
One of the problems I see in the way most people trade is that they’re missing the majority of the contextual factors that allow you to anticipate what may happen next.
This means your decision-making, including whether to enter or exit a trade, is based on incomplete information and will mostly lead you to wrong conclusions.
Let me show you what I mean with the most common issue.
To start with, let’s consider what statement you’re making when you plot something on your chart. Let’s say you’ve added a specific level or a zone.
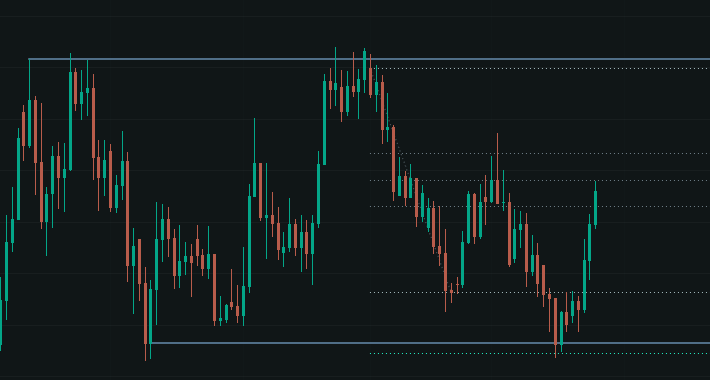
Why are you singling that out as being significant?
What is it about that particular price area that’s different to anywhere else?
This is something you might never have thought about. Most traders just look at levels as being somewhere that the price will reverse or break out. But those are outcomes; they’re descriptions of what the price may do afterwards. They don’t explain what’s actually happening at that level and why it’s being singled out as significant.
At Duomo, we call these “significant levels”, and they’re defined as a price point or area where we can anticipate there being a shift in activity.
Whether you realise it or not, that’s the same statement you’re making when you plot levels. You’re suggesting that you can expect a shift in activity there. Otherwise, why plot them?
(In reality, most of the things traders plot on their charts are completely arbitrary and don’t lead to any change in activity at all. But that’s a discussion for another day!)
But what is “activity”, and what does it mean for there to be a shift in activity?
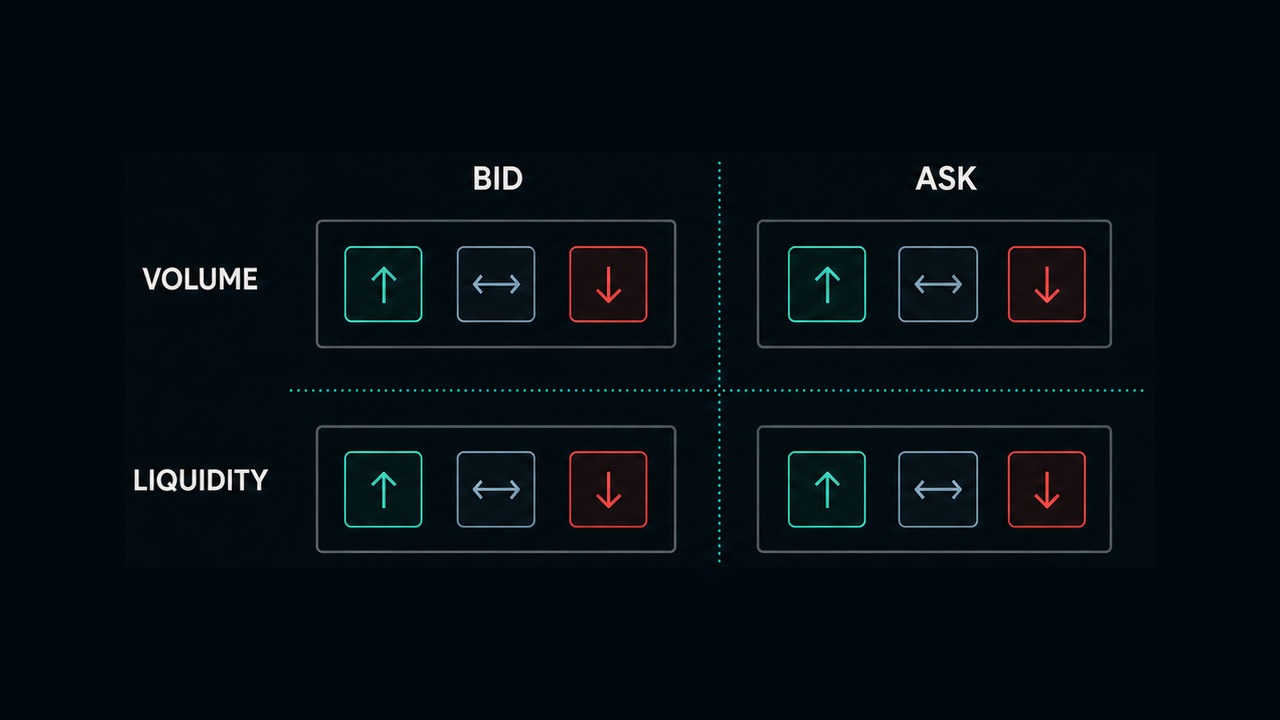
All price behaviour can be explained in terms of the amount of volume and liquidity on the bid and ask sides of the market.
In simple terms: liquidity is the passive orders sitting in the market, waiting to be transacted with. Volume is the aggressive market orders coming in to transact with them. If you’re not familiar with this or how markets function, I’d suggest watching my recent video that explains it in detail.
We can call this combination of volume and liquidity “activity”.
Changes in activity will be happening all the time. But when you map a level, you’re presumably saying that the shift in activity is likely to be significant enough to change the market dynamics in a meaningful way. That might mean a reversal, a breakout, consolidation, a change in structure, or some other major change.
But that change in activity can come in many different forms. There are four broad categories for the activity in the markets:
- Bid liquidity
- Bid volume
- Ask liquidity
- Ask volume
At any point in time, each of these categories has a particular state, and together they dictate price behaviour.
When price reaches a genuine significant level, the major shift in activity can happen in one or several of those broad categories. Different combinations of those changes will lead to very different outcomes for the price.
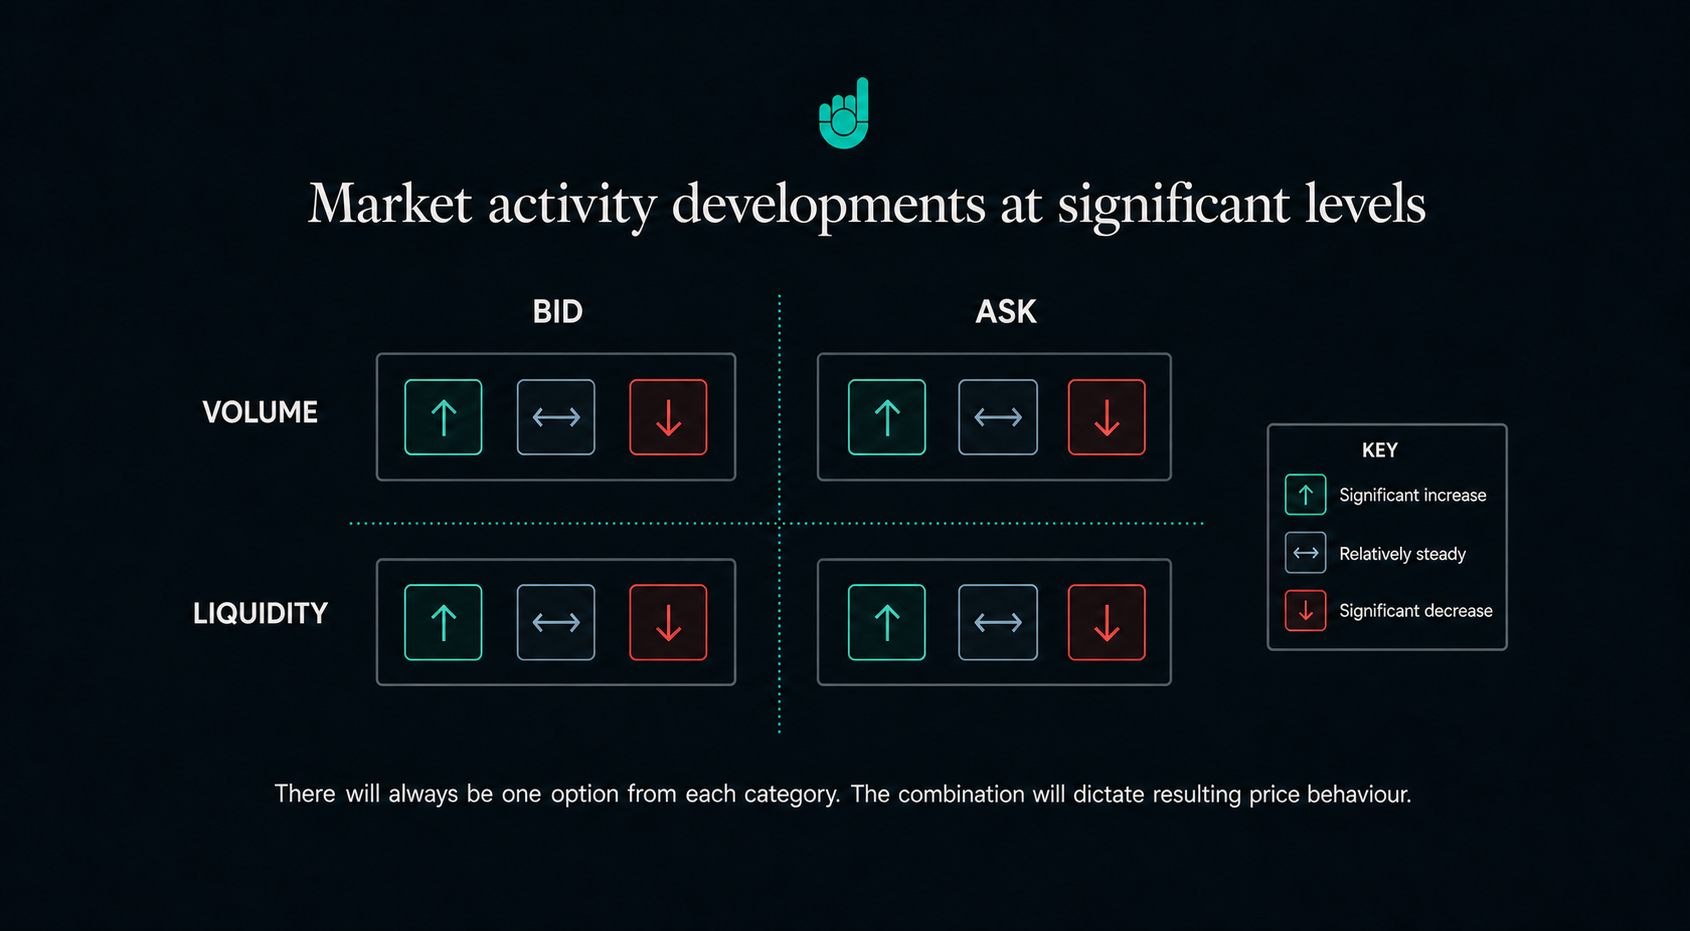
Therefore, you not only need to consider how the significant level will shift activity, but also what the activity is prior to that.
For example, let’s say we expect an increase in ask liquidity at the significant level. If price moves towards it with strong buying volume, that liquidity may only partially absorb the buying, leading to a temporary pause before price continues through. But if price arrives with weak buying volume, that same liquidity could overwhelm it and trigger a reversal.
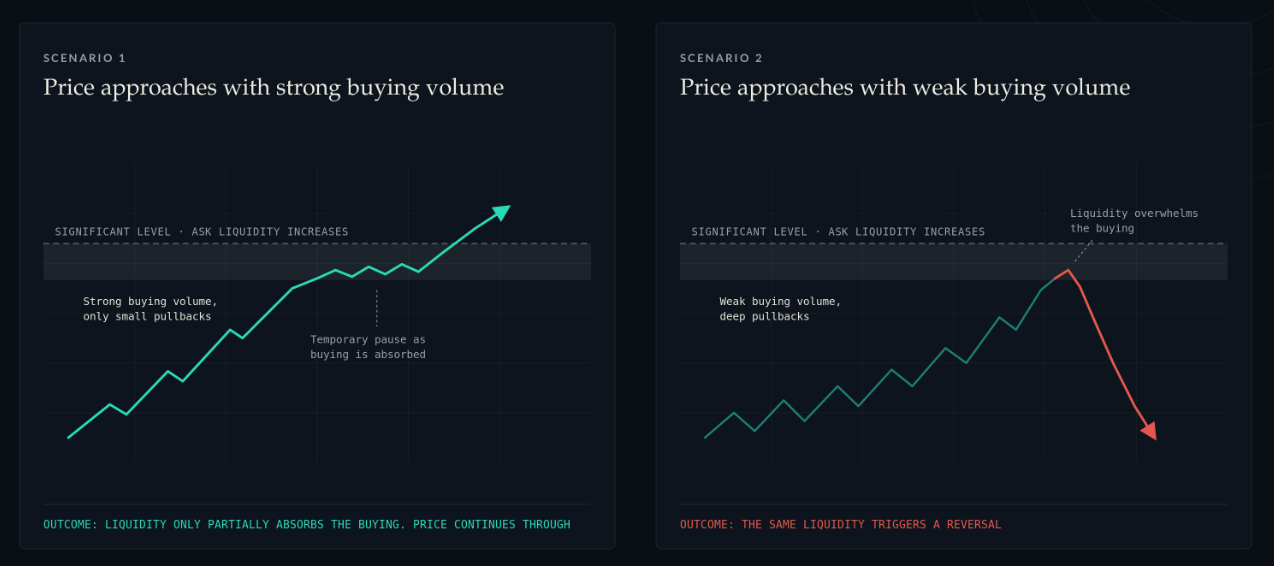
Two completely different outcomes from the same significant level. The difference is the activity behind the move.
Most traders never think about any of this. They plot a level and assume what will happen. They’ll plan entries ahead of time, saying things like, “As soon as this price level is touched, I’ll enter a short trade ready for a reversal.”
But if you’re treating every touch of a significant level as a reversal setup, without considering the wider context, you’re going to be reaching the wrong conclusion the majority of the time.
This is why the context of the market is so important. By analysing it, we can pick up on clues about the activity we have before the level and the shift we can expect at it. That allows us to make informed assumptions about the potential outcomes and narrow down the possibilities.
Let me walk you through a real example to show you what I mean.
Example: GBP/NZD
Here’s the daily chart for GBP/NZD:
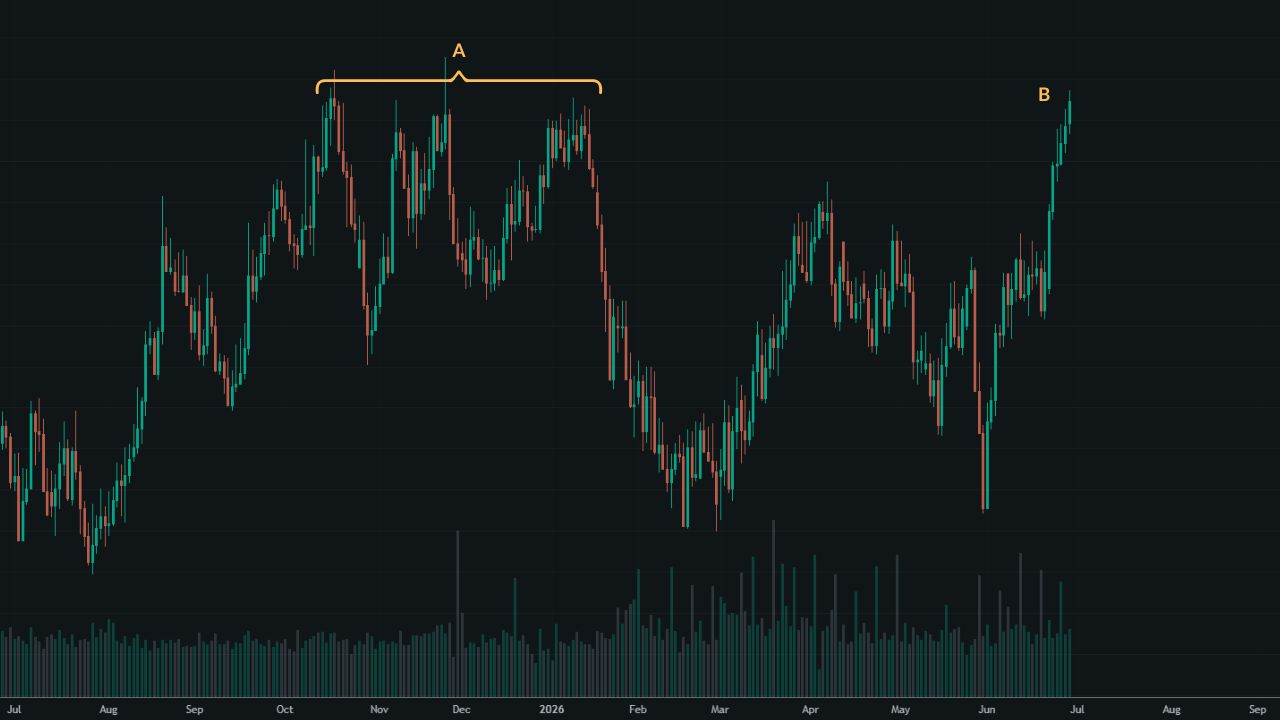
At point A, we have a major high with multiple strong reversals. We can expect a big shift in activity to take place again in this area, which we can plot with a zone or multiple horizontal levels.
At point B, the price returns to that area. This is where many traders would automatically enter a short trade, as price is retesting the significant level.
That decision would only consider the possible shift in activity from that level. But without analysing the full context, we have no idea what the actual shift in activity or resulting price outcome will be.
As we can see, the price ends up consolidating in that area rather than having a strong reaction.
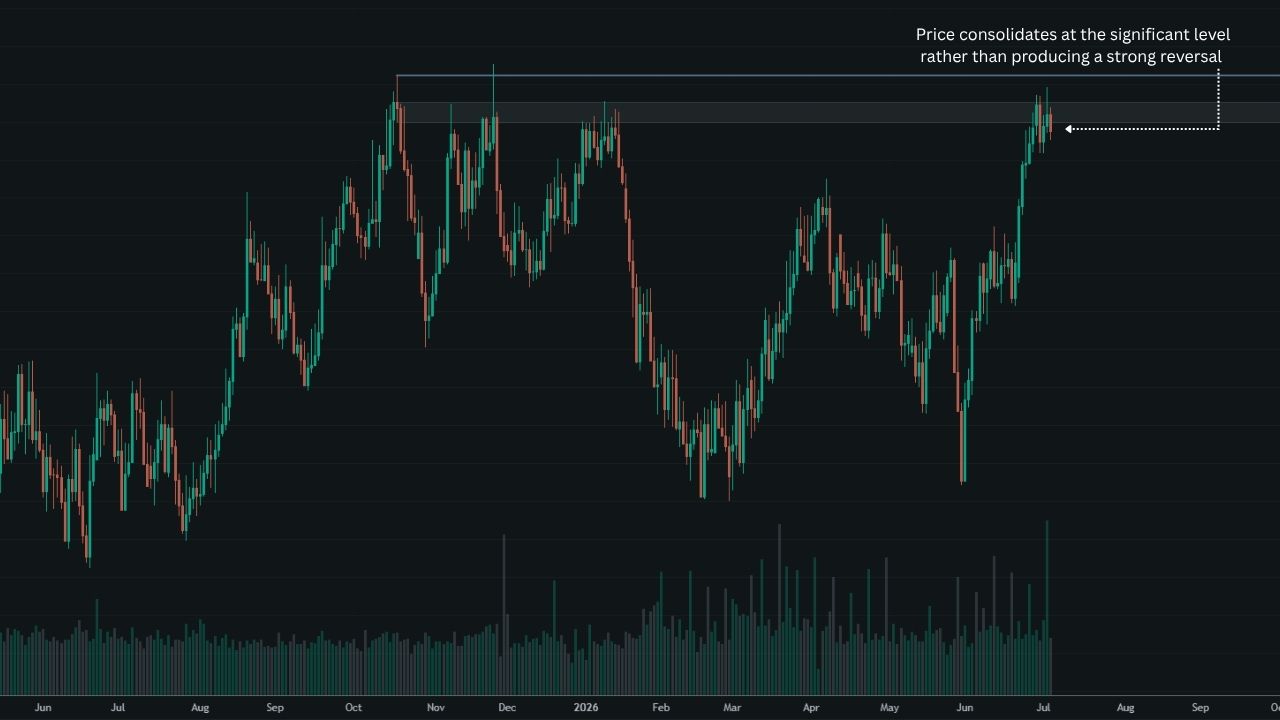
We could have anticipated this by picking up on clues from the context, which would have set us up to plan a more precise opportunity.
So let’s go through some of the key factors that help us to understand the context in this situation.
You don’t need to follow every detail here, especially if you’re not a member of the Duomo Trader Development Program yet. What I want you to notice is how we can follow a cause-effect sequence:
Understand the past context → interpret the current context → anticipate the potential future context.
For a full Duomo analysis and investigation, we’d also plot significant levels and use multiple time frames. But in this case, we’ll just rely on the daily chart and focus on clues from the activity itself.
One note before we start: the letters on this next chart are a fresh set of labels, so they don’t match points A and B from the first screenshot. The area we looked at earlier comes back into the story at points G to I.
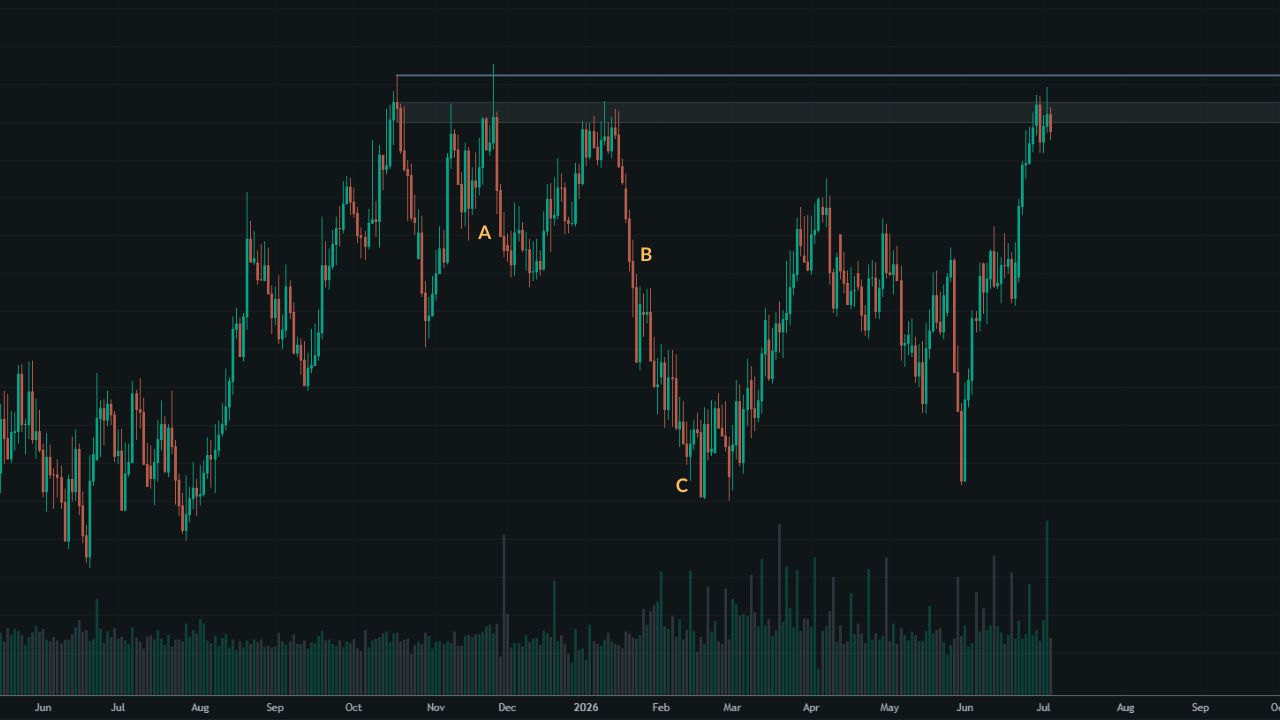
A: The market was in a sideways structure, with strong reattempts to break the high, which all failed. The market was continuing to transact in that area for a prolonged period, which makes it a high activity area. Strong initiative action would be needed to break out higher or lower.
B: Eventually, we see that happen with a strong bearish move. We know it’s strong for two reasons:
- It needed a lot of aggressive participation to break that area,
- It’s predominantly one-way activity with very limited pullbacks, showing a large imbalance (far more aggressive activity on one side than the other).
C: After breaking lower, there are signs that bearish strength is reducing; there’s more two-way activity. However, we see only minor bullish fluctuations rather than deeper pullbacks, showing us the bearish move is well supported with good participation. The move comes to an end, but the activity shows us that this isn’t because of a strong bullish reversal taking control, but more likely that bearish strength faded and prices started being accepted, meaning the market was willing to keep transacting at these prices rather than pushing away from them. Looking to the left, we can see reasons why absorption (passive orders soaking up the aggressive selling) may have happened here.
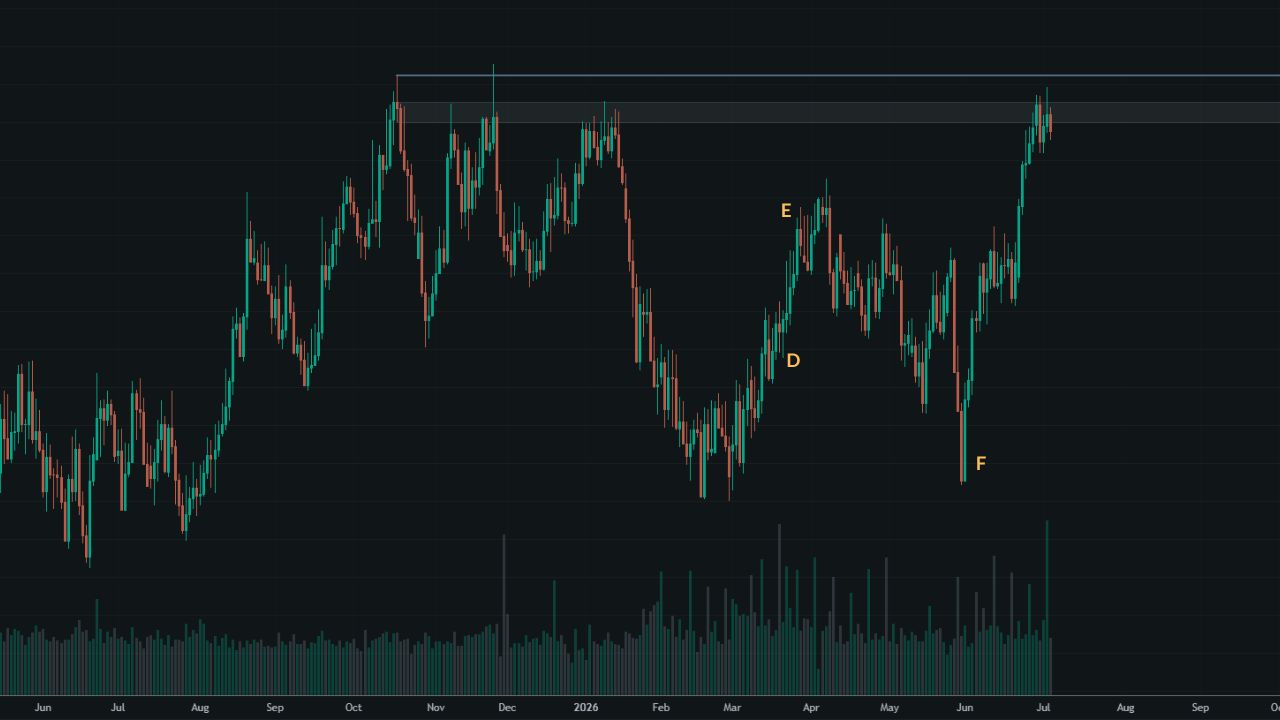
D: After prices are accepted at point C, bullish activity takes control of the market. You’ll notice the move isn’t as direct as the one seen at point B. This is expected, since we already knew the bearish move had good participation and was well supported, so it would take a lot of activity to retrace that move. Despite that, there are only small pullbacks during the bullish move, showing this is a strong move and not just a corrective rebound from point C.
E: We discovered at point A that this was a high activity area, and we needed a lot of aggressive participation to break lower (point B). The bullish move had good participation, but still failed to move beyond this high activity area. The conclusion here is that we will need to see a lot more aggressive bullish activity to overcome this level and move higher.
F: After failing to break the high activity area, we begin a short-term bearish trend. Unlike the previous two moves (points B and D), this is a structured move rather than being direct. This shows us there’s a lot more two-way activity here, which means activity will be building up in this area. Attempts to break higher are met with strong responsive action pushing price lower. Eventually we see herd activity in the final leg of the trend, which is instantly reversed (in the same region as point C), showing the final move was thin.
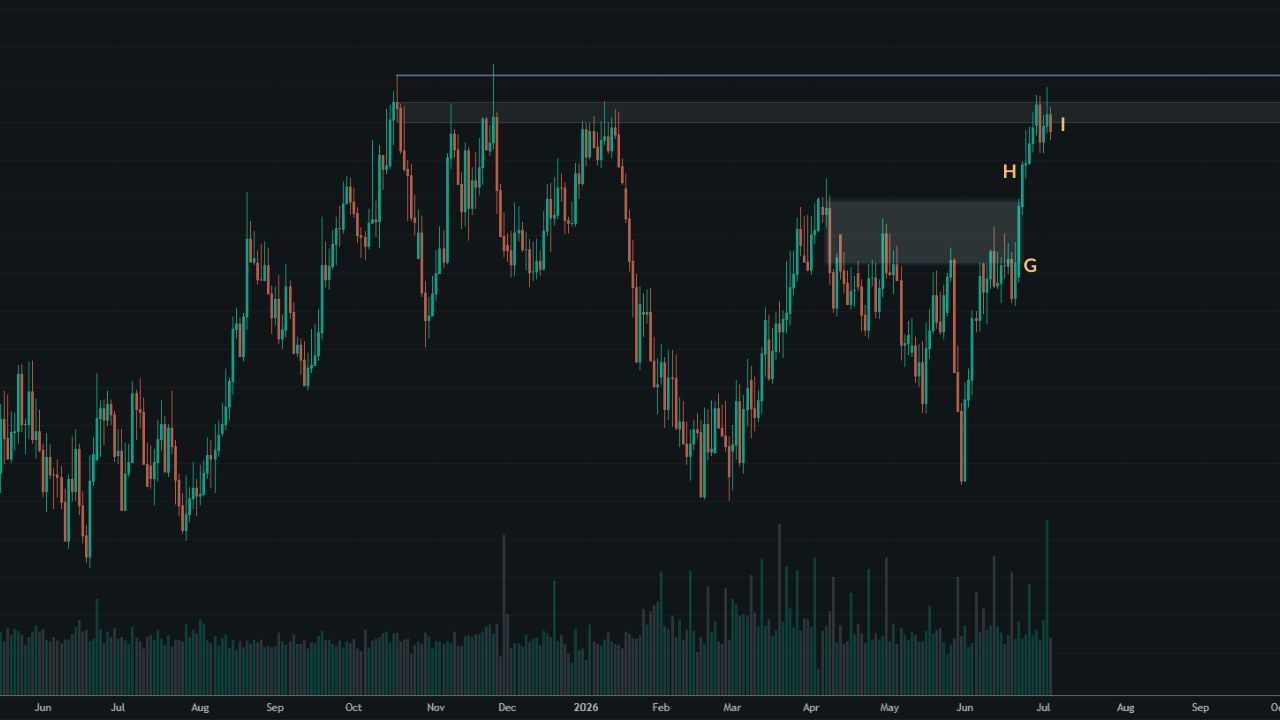
G: We have a strong imbalance that drives price to point G. We are in the area where we previously saw the lower highs with strong bearish reversals (marked with a shaded area in the screenshot). Therefore, we know this is a strong path of resistance and there’s likely to be a big shift in activity. Despite that, price consolidates rather than reversing. So there’s still good bullish participation, the move is getting absorbed but aggressive participation is still present. This is a typical ‘overcome’ situation rather than prices being accepted, where one side or the other will prevail (either liquidity at the significant level will absorb bullish activity, or liquidity will be cleared which leaves a strong bullish imbalance through the level).
H: We see that the bullish activity prevailed and we broke through the significant levels. We already knew a strong move was needed to break this area. Not only because of the recent activity, but also going back to points A, B, and E. It didn’t just overcome the shifts in activity in this area, but did so with a big imbalance. Therefore, this is undoubtedly a very strong bullish move.
I: That leads us to the interaction with the major significant levels, at the price the market had now reached. We know there will be a very big shift in activity there: based on the strong reversals in the past, we can expect a lot of liquidity on the ask and a lot of aggressive volume hitting the bid. In most cases, that would mean another strong bearish reversal. However, by following the clues and understanding the context, we also know the move towards this level is very strong. This is another ‘overcome’ situation, and rather than an instant reversal, it’s more likely that we see consolidation or a slow grind higher as the bullish move starts to be absorbed, before we get the next meaningful move.
To summarise the story so far: every move towards this top area gave us clues that the buying was strong and well supported. That’s why an instant reversal was never the most likely outcome here, even though this is a genuine significant level where strong reversals have happened before.
Current Context and Potential Outcomes
There are a few potential scenarios at play at this point, which will influence what may happen next.
-
It could be that the bullish move gets absorbed and participation reduces. This would mean the aggressive bearish activity will prevail and price will eventually move lower.
-
It could be that the bullish aggression stays, and eventually the liquidity absorbing the move is taken, so price continues higher.
-
If price stays there long enough with strong responsive activity on either side, the market might not have enough conviction either way. Prices will be accepted there until something significantly changes in the market leading to renewed conviction to move higher or lower.
This means we could now investigate further. We can look at lower time frames, or wait for specific things to take place that inform us one way or another about what’s going to happen.
What we’ve done so far is use the past context to understand the move towards this area, and we’ve used it to interpret the current context with a range of potential scenarios. Then, in terms of potential outcomes (the basis of an opportunity), there are other things we need to consider.
For example, if price breaks higher:
- Will the bullish move have been exhausted by that point due to the absorption that happens in that area?
- Will the move have enough participation to continue further and not be exhausted?
- Will breaking the level actually lead to a herding effect, as more market participants realise that strong area has been overcome and think that informed traders know something they don’t?
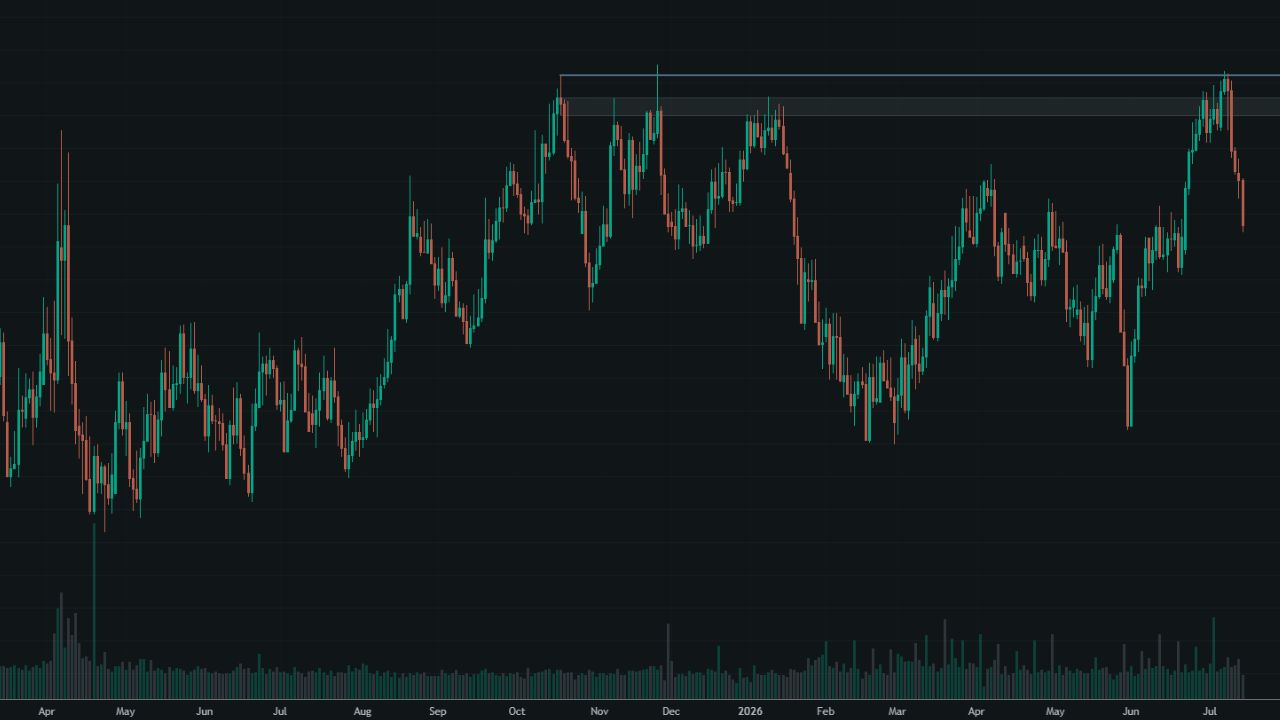
In the end, we can see it was the first of those outcomes. The bullish move overcomes the initial shift in activity, but shows no follow-through, indicating possible exhaustion. As a result, we get a sharp reversal at the next significant level.
If you’re not a member of the Duomo Trader Development Program, this may seem like a lot to take in. But once you understand the foundations of how to interpret context, this process is relatively straightforward. The market gives us more clues than most traders realise, which you can uncover by understanding how to follow the narrative.
What I’ve described is part of the ‘Investigator’ process. It involves taking the information we discover on the charts, and connecting the dots to figure out the context. This leads you to taking much better opportunities and planning the right strategies for them.
If you want to see an example of how this forms a real trade opportunity, check out this breakdown of a recent trade I took on EUR/CAD.
Free Training Series
Start the free training.
Get free access to our 5-part training series. It covers the foundations of the Duomo approach, how to analyse markets logically, and the skills serious traders need to develop.