A logical case for how trading should be approached
00
Introduction
At Duomo, our approach to trading is built around one simple idea:
Trading isn't about finding the right setup. It's about learning to forecast the markets accurately enough to identify positive expectancy opportunities, express those forecasts through the right actions, and improve that skill over time.
Everything we teach flows from that.
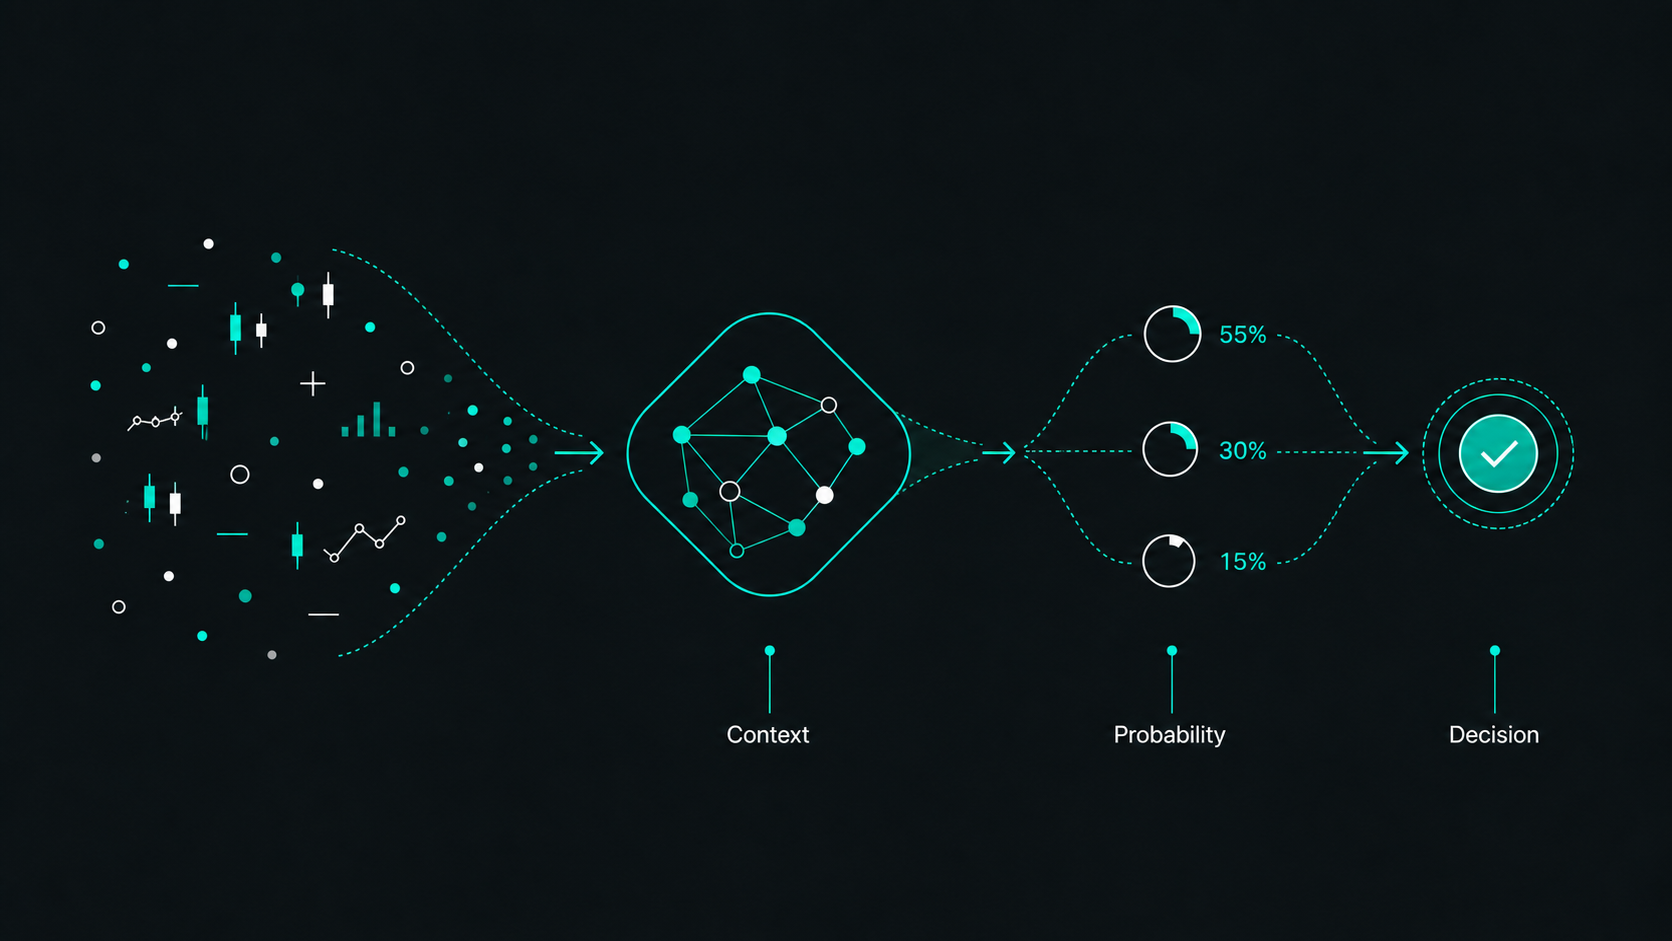
We start with how markets move. Price movements happen because of imbalances between volume and liquidity. When those imbalances continue, price can keep moving. When the activity behind those imbalances changes, the movement can change as well.
That means the job of a trader isn't to stare at the chart looking for familiar patterns. The job is to understand the activity taking place in the market, the meaningful outcomes that activity may create, and the probabilities of those outcomes.
That's why we focus so much on context.
Context is what allows us to turn market information into a forecast. It's what helps us decide whether a move has genuine strength behind it, whether a price level is meaningful, whether a trade has positive expectancy, and whether the right action is to enter, stay out, scale in, scale out, reduce risk, or exit.
So the Duomo approach isn't:
Find a setup. Enter the trade. Hope the risk-reward ratio works out over time.
The Duomo approach is:
Understand the market context. Identify meaningful potential outcomes. Estimate the probabilities of those outcomes. Determine whether there's positive expectancy. Use strategy to express that forecast through coherent action. Track the accuracy of the forecast and the quality of the action. Calibrate and improve.
That might sound like a small difference at first, but it changes everything that follows.
Most traders have been taught to play the wrong game. They think the aim is to find the thing that tells them price will go up or down. But trading isn't about knowing what will happen next. It's about understanding what could happen next, estimating the relative probabilities, and only acting when the potential return, potential risk and probabilities combine in your favour.
In this guide, we'll build the logical case for that approach from the ground up.
The aim isn't to tell you that everything else is wrong and Duomo is right. That's not useful. The aim is to walk through the logic from the ground up so you can see for yourself what trading actually requires.
Because once you see the logic clearly, a lot of the things traders are usually taught start to look very questionable.
01
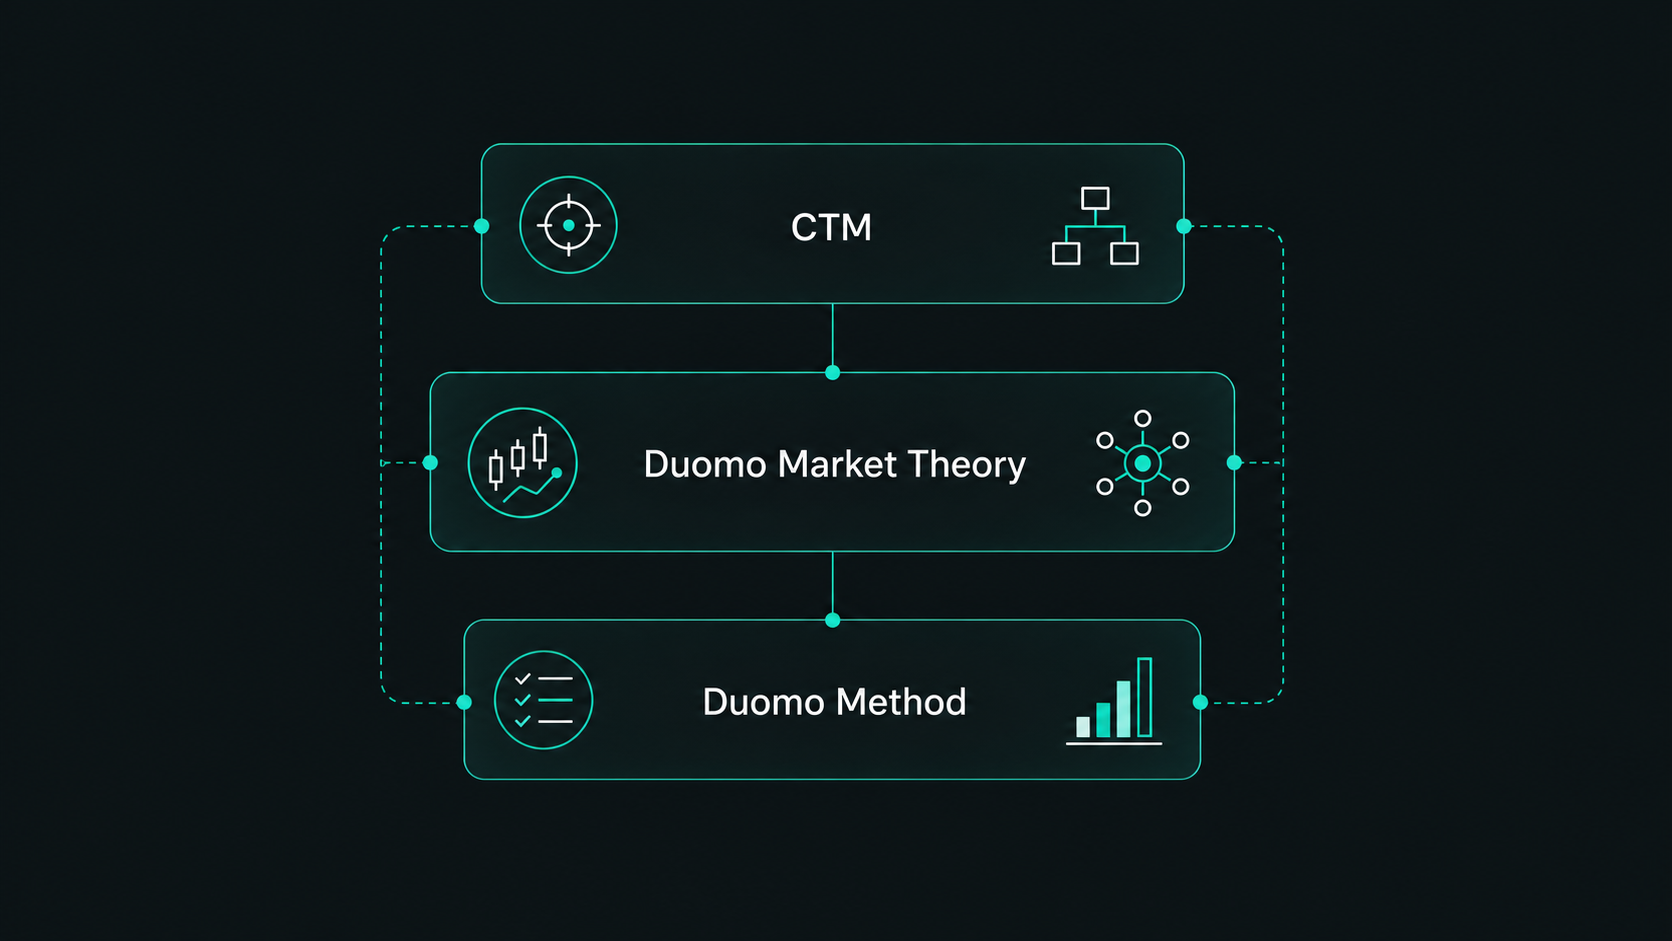
The Three Layers of the Duomo Approach
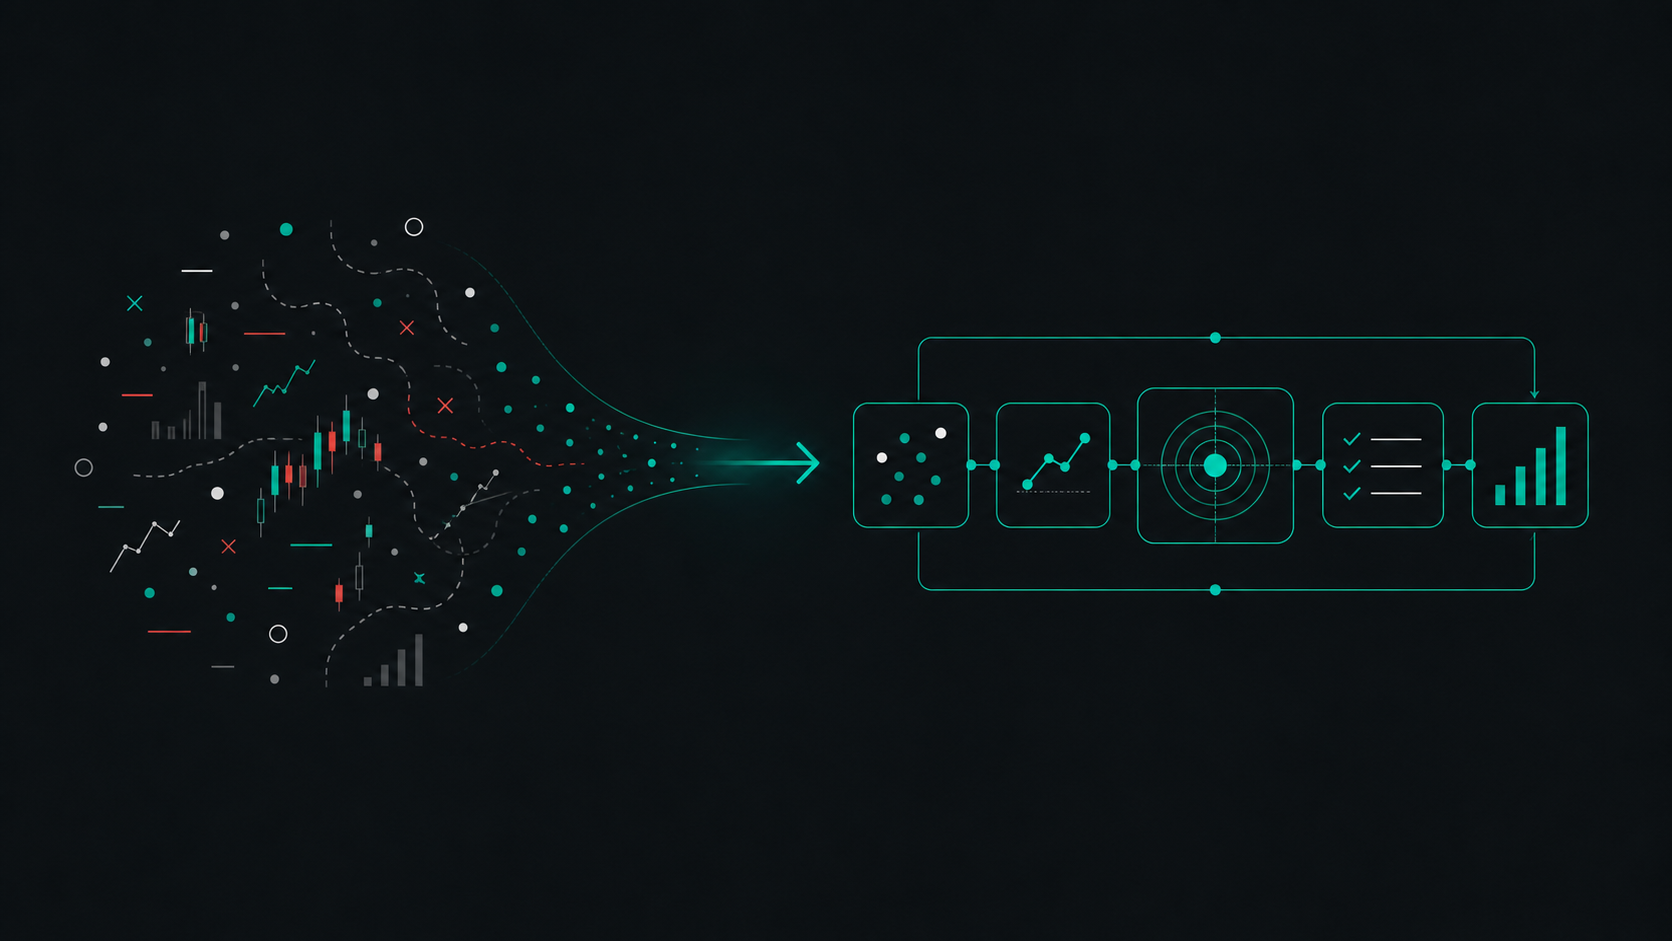
There are three connected layers to the way we think about trading at Duomo.
The first is the Cohesion Trading Model, or CTM. This is the overall blueprint for how trading should work as an operating system. The reason cohesion is in the name is because every part of your trading should connect logically as one model. Analysis, strategy, risk management, data collection, psychology and optimisation shouldn't be separate fragments that you think about in isolation. Each part should have a clear purpose and feed into other parts of the process.
The CTM is built around four roles: the analyst, the investigator, the strategist and the calibrator.
The analyst collects meaningful market information.
The investigator connects that information together to understand and interpret the context, so that it can produce a forecast.
The strategist turns that forecast into action through trade execution and management.
The calibrator uses the data that comes from those forecasts and actions to find reliable improvements.
Every trader is doing these roles whether they realise it or not. The problem is that most traders mash them together. They call everything strategy, or everything analysis, or they think the purpose of everything is just aimed towards finding profitable trades. This causes problems, since each role requires a distinct mode of thinking. It also makes it difficult to specifically identify what's working or not, and where there are skill or performance gaps.
The CTM separates those roles so the whole process becomes easier to understand, track and improve.
The second layer is the Duomo Market Theory. This is our proprietary theory that underpins the Duomo Method. It's our explanation for why price movements behave the way they do, why certain price points can become significant, why market activity can sometimes be anticipated, and why the Duomo Method uses the tools it does.
A trading approach needs an underlying theory. Otherwise the trader is just doing things because they seem to work, or because someone found examples on a chart. A theory gives the analysis meaning. It gives actions a reason. It allows things to be tested properly. It helps separate genuine causality from coincidence.
The third layer is the Duomo Method. This is the practical technical analysis method derived from the Duomo Market Theory. It's how we read price movement, identify significant levels, understand market context, anticipate meaningful outcomes and make decisions in the live market.
So the structure is:
The CTM explains how the whole trading process should function as one operating system.
The Duomo Market Theory explains why the market can be read in the way we read it.
The Duomo Method gives the practical aspects for doing that analysis and making decisions.
02
The First Question: What Is Trading Actually About?
If you ask most people what trading is, they'll say it's about buying before price goes up and selling before price goes down.
That explanation sounds obvious, but it isn't quite right.
If trading was simply about figuring out whether price will go up or down, the whole activity would be directional prediction. The trader would look for a sign that suggest "up" or "down", enter the market, and then judge whether they were right or wrong based on what happened next.
This is the way most traders behave.
They look for entries. They try to call direction. They talk about being right or wrong. They get frustrated when price stops them out before eventually moving in their direction. They treat profitable trades as evidence of good decisions and losing trades as evidence of mistakes.
But that's not how a probabilistic activity works.
A good trade can lose. A bad trade can profit. A trader can make money by luck for a while. A trader can lose money for a while even if they have an edge. Over a small sample size, randomness can look like skill and skill can look like randomness.
That's the first thing trading approaches usually fail to deal with properly.
If an activity has probabilistic outcomes, you can't judge the quality of a decision by one result. You have to judge whether the decision had positive expectancy at the time it was made, and whether the trader's estimates prove accurate over a large enough sample size.
So trading isn't about predicting the future with certainty.
Trading is about forecasting uncertain outcomes.
That means a trader needs to be able to answer questions like:
If a trading approach can't help you answer those questions, then no matter how good it seems, it's usually not fit for purpose.
03
Why Profit and Loss Can Mislead You
Most traders think they can tell whether something works by looking at the returns.
If it made money, it works. If it lost money, it doesn't. If a trader has a profitable month, they must be doing something right. If someone online shows big returns, their method must have value.
The problem is that profit and loss can be completely misleading.
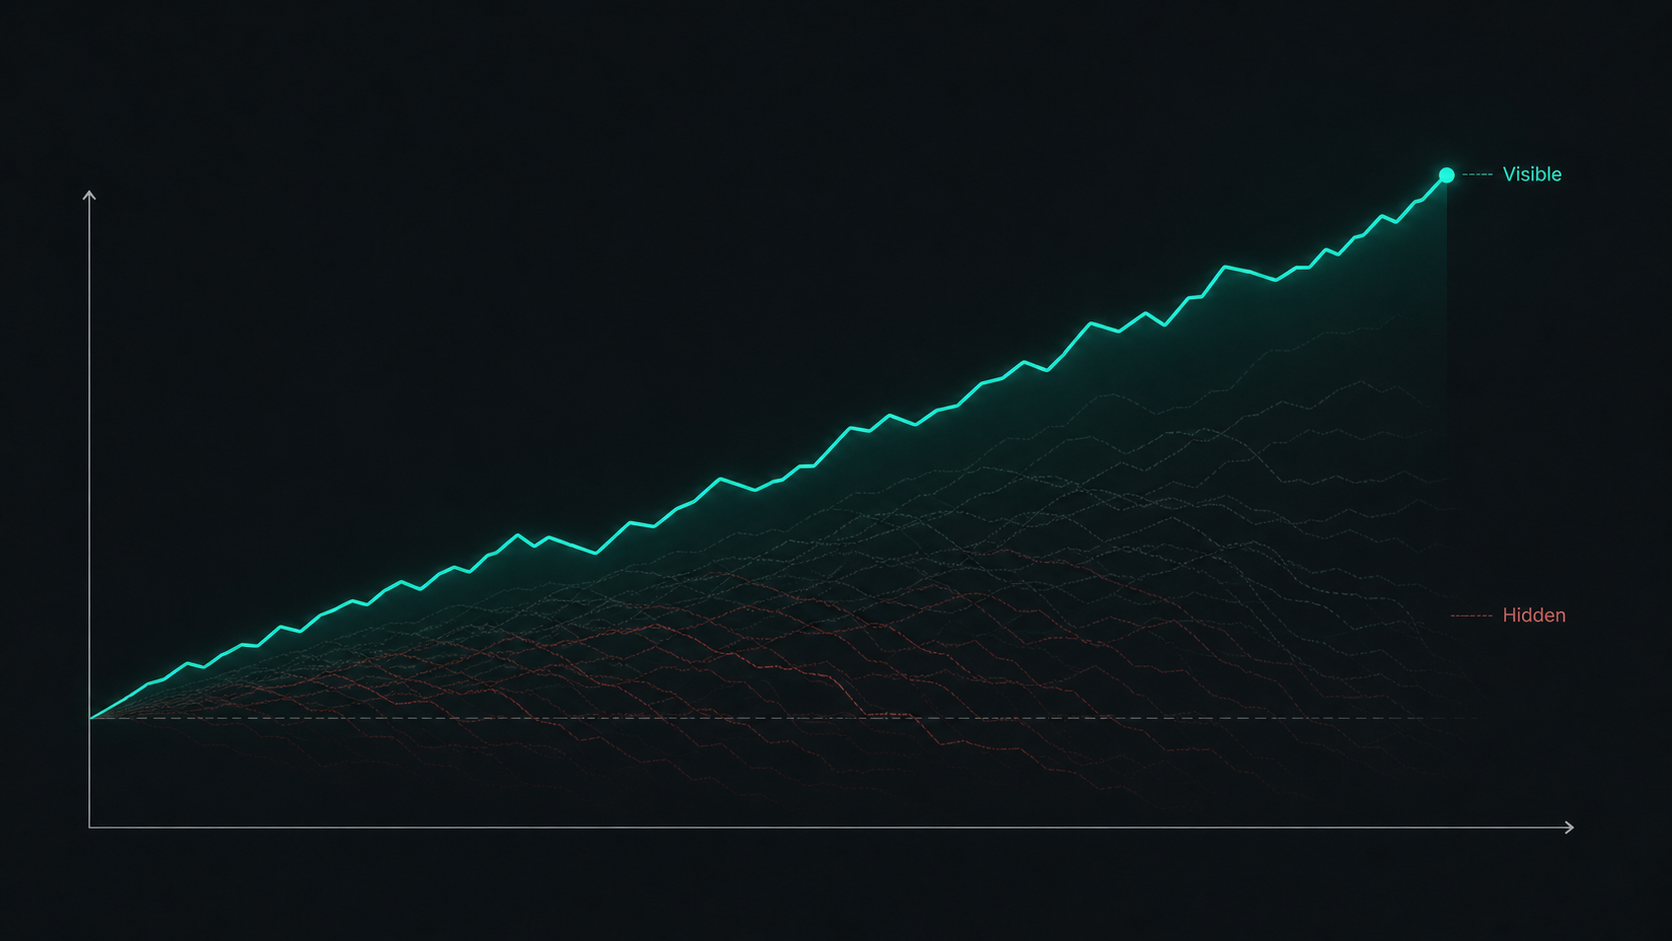
Random strategies can produce amazing returns over short periods. If enough people flip coins and take random trades, some of them will look like geniuses for a while. That doesn't mean they have an edge. It means the positive side of randomness is visible and the negative side is either hidden, ignored, or explained away.
This is one of the biggest traps in trading.
People see profitable results and assume skill. They see social proof and assume validation. They see someone confident and assume competence. They see a popular method and assume there must be something to it.
It's the Halo Effect in action. But popularity does not mean predictive power.
The more traders there are using random or illogical approaches, the more likely it is that some of them will show impressive results by luck.
This creates what we call the Random Results Treadmill.
At the industry level, the treadmill starts when a trading approach becomes popular but never had a genuine repeatable edge.
Some traders using that approach will inevitably get good results for a while, even if those results are just the positive side of randomness. Those traders become the examples everyone uses to validate the approach. Their results become the proof. They endorse it through testimonials, reviews, comments on social media, or even start teaching other people themselves.
Meanwhile, the traders who lose either disappear, switch to something else, blame themselves, or assume they just need more discipline. Their results don't become part of the story. So the public evidence becomes distorted. Everyone sees the lucky winners and assume the larger group of people who tried the same thing and got nowhere just didn't do it right.
Then more traders are pulled in. Some of them get lucky too, which creates more examples, more social proof and more confidence around the approach. Some of those traders eventually start teaching it, even if they still don't know whether their results came from skill or luck. The method spreads further, not because it has been proven logically, but because randomness has produced enough temporary 'success' stories to keep the belief alive.
That is the wider Random Results Treadmill. Randomness creates examples. Examples create belief. Belief creates more traders. More traders create more lucky examples. And the whole thing keeps feeding itself.
This is why popular trading approaches can get retaught for years without even having a real edge. They don't need to work reliably for most people. They only need enough people to appear successful for long enough that everyone else assumes the approach must be valid.
The same treadmill then shows up in a trader's own development.
A trader learns a method and starts getting mixed results. When things go badly, they ask the obvious question: what am I doing wrong? But because their trading isn't set up in a way that isolates the problem, they can't know the answer. So they guess. They change something that feels tangible, maybe the market, the time frame, the entry criteria, the stop placement, the risk, or some extra confirmation.
They'll keep changing things until their performance improves for a while, which convinces them the last change they made actually worked. But if that improvement was just random variance, it won't last. When things fail again, they repeat the process and look for the next thing to change.
They feel productive because they're constantly adjusting, learning and trying harder. But really they're correlating random changes in performance with whatever they happened to change most recently.
The reason they can't escape is that their trading isn't set up in a way that lets them isolate what's actually working.
They don't know whether their analysis has predictive power. They don't know whether the variables they use actually shift probabilities. They don't know whether their positive results came from skill or luck. They don't know whether a losing period means the approach is wrong, they executed badly, or they're just seeing normal variance.
So they guess. And when guessing doesn't work, they usually blame psychology.
Of course psychology plays a role. But if the process itself isn't logical, psychology becomes the convenient place to dump every unresolved problem. The trader is told to be more disciplined, more patient, more confident, less emotional. But no amount of discipline will turn a random approach into a skilled one.
Before a trader can improve reliably, they need a better measure of performance than short-term profit and loss.
At Duomo, that measure comes from the accuracy of probability estimates and the relationship between estimated probability and base rate.
04
The Base Rate Comes First
Imagine you're offered a trade where you risk 50 pips to make 50 pips (1:1 R:R).
You can't see the chart. The direction is chosen by a coin flip. Do you take it?
Hopefully not.
There's no advantage. You know nothing about the context. The potential profit and loss are equal, so without any additional information there's no reason to expect one outcome over the other.
Now imagine the trade risks 50 pips to make 150 pips (1:3 R:R).
Still no chart. Still a random direction. Do you take it now?
A lot of traders are tempted to say yes because the risk-reward ratio looks favourable. But the answer should still be no.
If a 1:3 risk-reward ratio had an inherent advantage, you could take random trades with that ratio and make money forever. But you can't. The further target will naturally be reached less often. The ratio doesn't create an edge by itself.
This is why risk-reward ratios have no meaning in isolation.
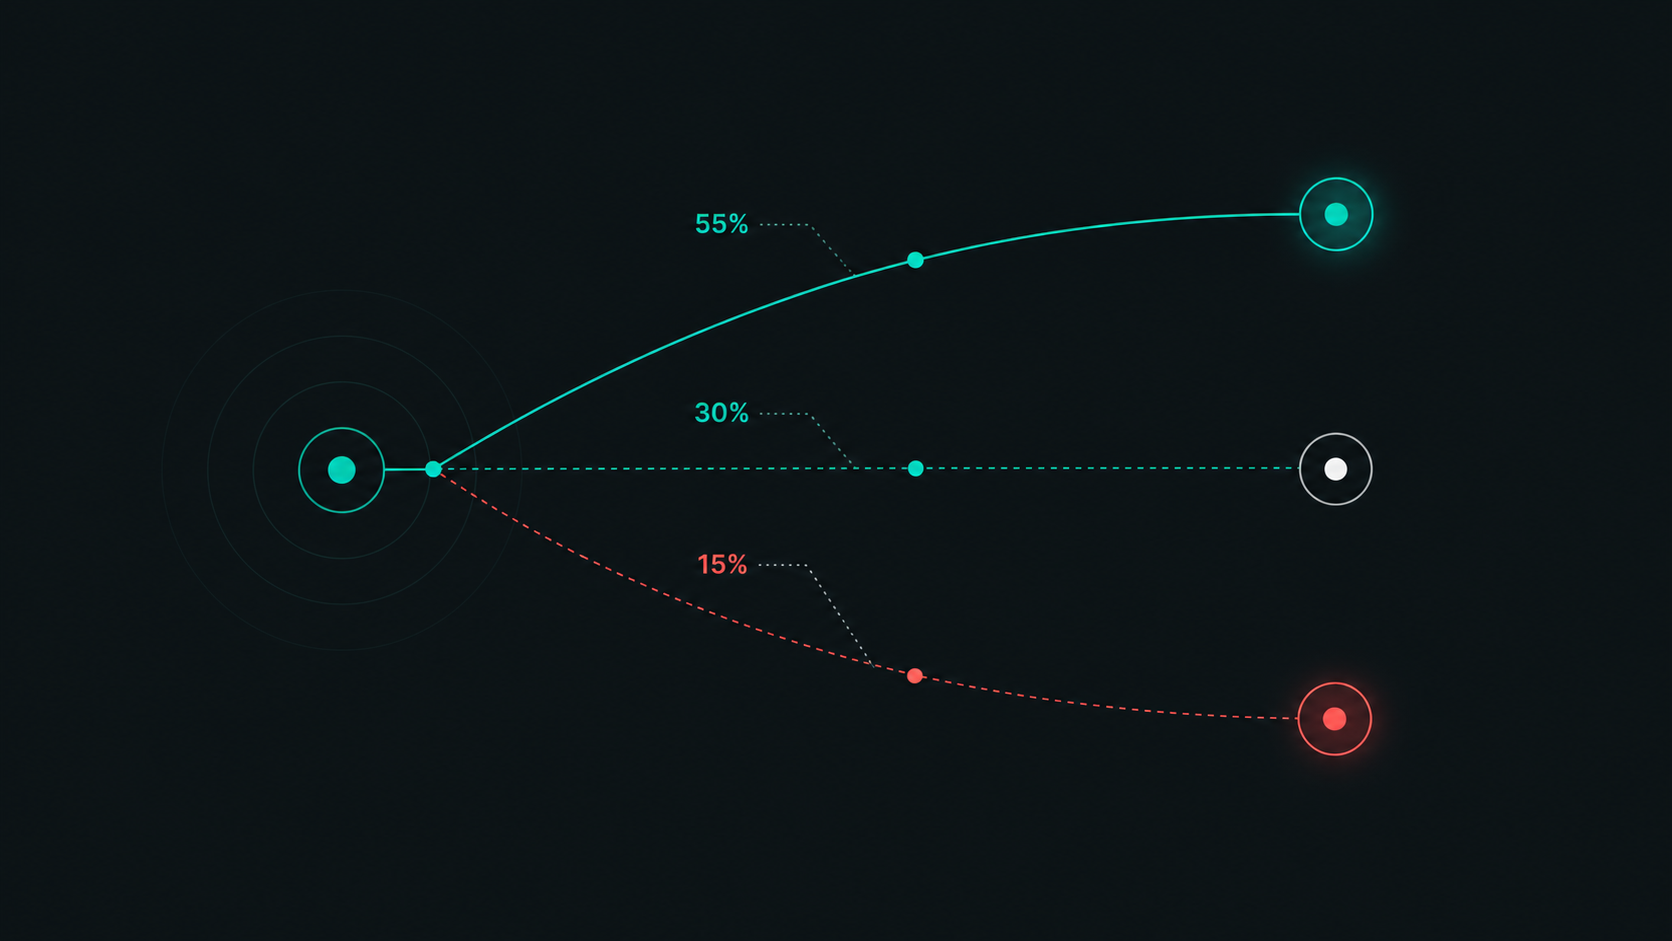
The real question is whether the probability of the profitable outcome is better than the base rate.
The base rate is the probability we would expect if price was moving randomly between the two outcomes. It's the starting point. If your estimated probability is the same as the base rate, the expected value of the trade is 0, so there's no edge. If your estimated probability is below the base rate, the advantage is against you. If your estimated probability is above the base rate, then you may have an edge.
This means every trade makes an implicit statement.
When you enter a trade, whether you realise it or not, you're saying:
The probability of this profitable outcome is higher than the base rate.
That is the statement behind every entry.
Most traders never make that statement explicitly. They say the setup looks good. They say the risk-reward is good. They say price is likely to go up or down. But if you press them on the actual probability, and whether it's far enough from the base rate to create positive expectancy, the logic usually disappears.
This is where the whole trading process needs to become more precise.
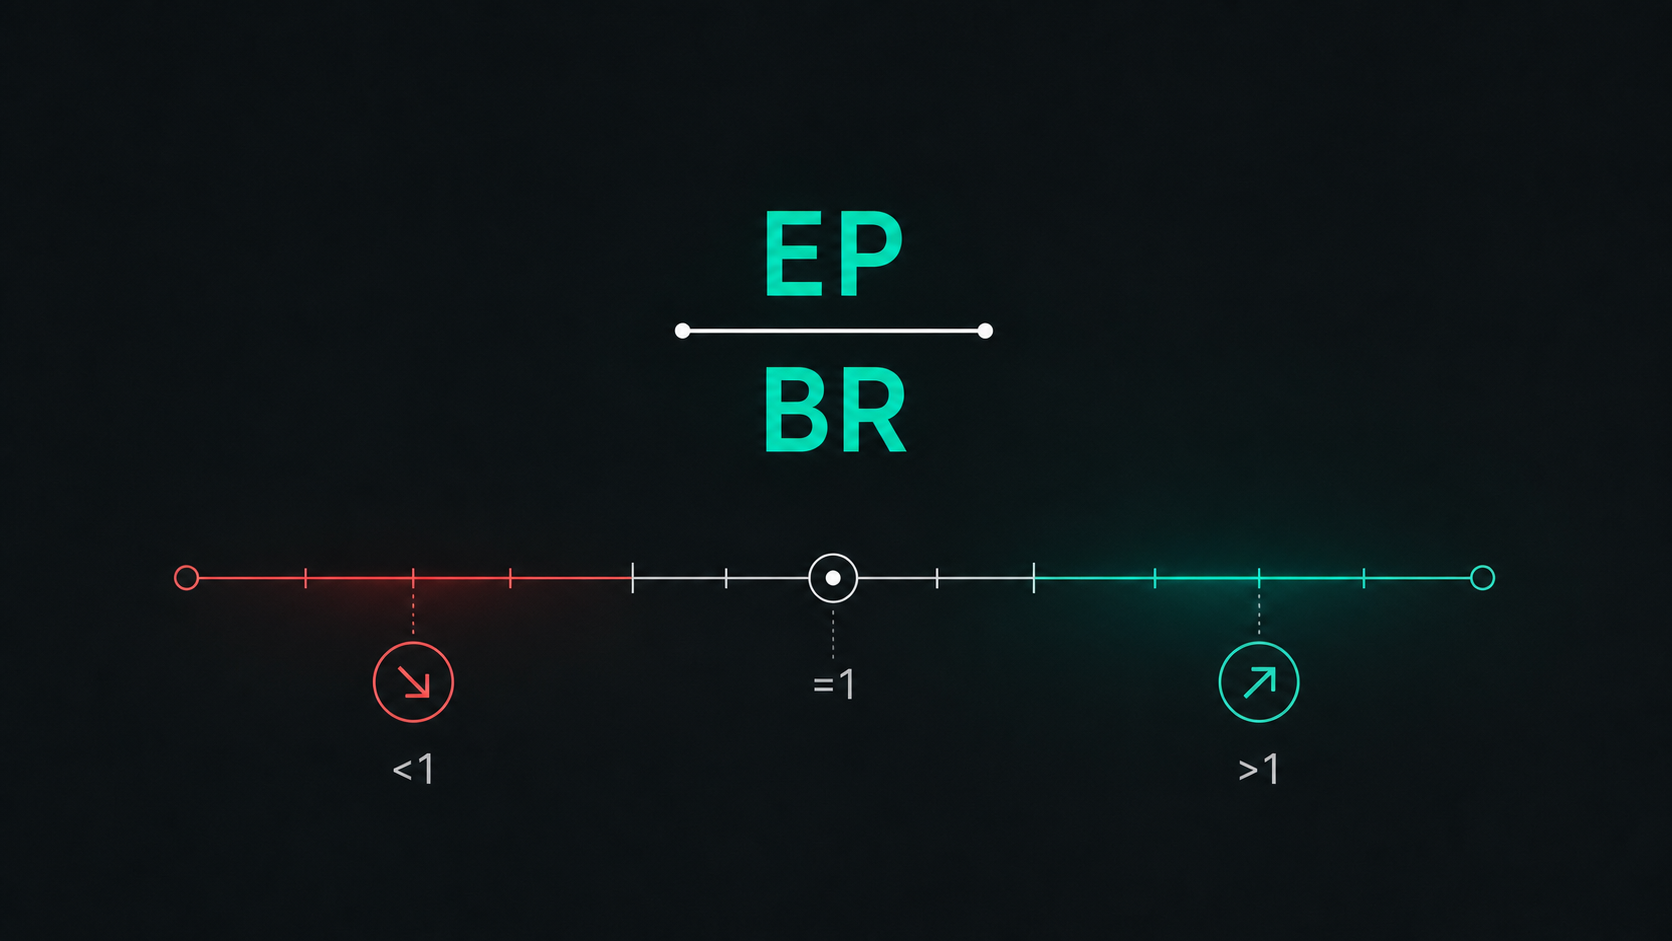
An edge is not a feeling of confidence. It isn't a setup appearing. It isn't a high success rate. It's the level of probabilistic advantage you have compared with the base rate, assuming your estimate is accurate.
At Duomo, a useful way we think about that is EP/BR:
Estimated Probability divided by Base Rate.
If EP/BR is above 1, you estimate that you have an edge. If it's at 1, you estimate there's no edge. If it's below 1, you estimate the edge is against the trade.
But there's an important caveat:
You can estimate any probability you want. If the estimate isn't accurate, it's irrelevant.
So your edge depends on two things:
That's a very different definition of edge from the one most traders use.
05
Why Setups Do Not Solve the Problem
Once you understand base rates and expectancy, a lot of common trading logic starts to look incomplete.
Take a setup-based trading approach.
A trader defines a set of conditions. Maybe price reaches a zone. Maybe a pattern forms. Maybe an indicator crosses. Maybe there's a liquidity sweep, a fair value gap, a break of structure, a rejection candle, or some other recognisable cue.
The trader then looks back at previous examples and says, "This setup works 60% of the time." (i.e. the success rate).
But what does that really tell us?
It might tell us what happened in a group of past examples. But it doesn't automatically tell us the probability of the current situation. The current context may be completely different. The outcome sizes may be different. The base rate may be different. The momentum into the level may be different. The activity around the level may be different. The structure may be different. The liquidity conditions may be different. The state of the market may be different.
So the real question is not:
Has this setup worked before?
The real question is:
Does the information in this situation justify adjusting the probability away from the base rate?
That's a much higher standard.
It means a setup is only useful if it tells us something meaningful about the current context and the probabilities of the outcomes ahead. If it doesn't, it's just noise.
This is why, at Duomo, we're so cautious about approaches that rely on unrelated patterns. It's very easy to find examples where X happened after Y. But that doesn't mean X happened because of Y.
Our brains are built to spot patterns. We can find shapes in clouds, meaning in randomness, and causality where there's only coincidence. In the markets, that tendency is dangerous because price will always move somewhere after a pattern appears. Some examples will always look convincing and can lead to confirmation bias.
The question is whether the pattern has predictive power beyond coincidence.
If it doesn't, it shouldn't be the foundation of a trading decision.
That doesn't mean every chart-based idea is useless. It means the visible feature has to be connected to something real in the market. It has to tell us something about activity, imbalance, absorption, liquidity, participation, or some other factor that can logically affect probability.
At Duomo, we aren't interested in memorising phrases in the language of the market. We want to understand the language itself.
06
Price Movement Has to Be Explained
If we want to forecast price movement, we need a theory of why price moves.
This is one of the biggest missing pieces in trading education. There are countless methods, patterns, indicators and strategies, but very few have a clear underlying theory explaining why they should work.
Sometimes the explanation is just "market psychology". But that's too broad to be useful. Nearly everything in the market can be described as psychology in some way. It doesn't tell you which specific information is relevant, when and why it becomes relevant, how it changes probabilities, or when it stops being useful.
The Duomo approach starts from a more practical foundation.
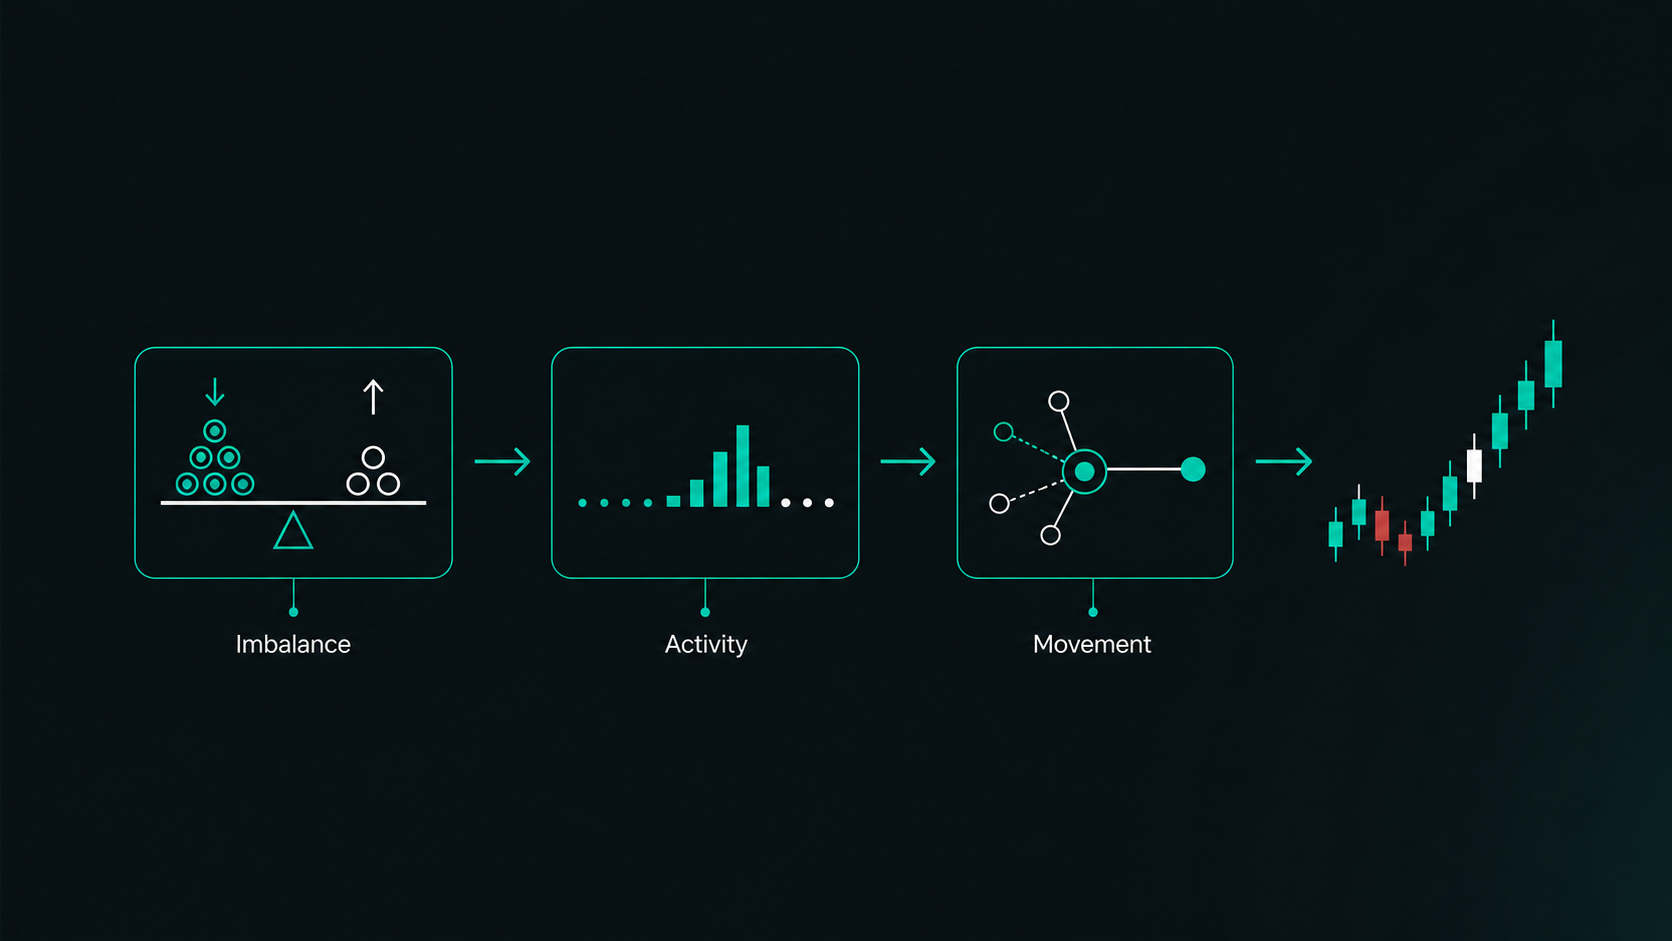
Price moves because of imbalances between volume and liquidity.
Market orders are aggressive. They want execution now. Limit orders provide liquidity. If aggressive buying overwhelms available selling liquidity, price moves higher. If aggressive selling overwhelms available buying liquidity, price moves lower.
From that, we can make an important connection:
The chart is a visual record of changing activity.
Momentum, pullbacks, turning points, consolidations, breakouts, volume changes and structure aren't just chart features. They're clues about the balance or imbalance of activity in the market.
That doesn't mean every movement is predictable. It's not. Markets contain random elements. They're also affected by new information, large participants, liquidity changes and all kinds of events that can disrupt the current activity.
But not everything is random either.
This is where the Duomo Market Theory becomes important.
The Duomo Market Theory came out of the work we did developing an algorithmic trading system between the end of 2012 and the beginning of 2014. The aim wasn't to find another pattern or another set of visual criteria. It was to understand the underlying dynamics of price movement itself, then test whether those dynamics could produce practical, repeatable methods for reading the market.
The important discovery was that price movement is not just a stream of disconnected random movements. There is randomness in the market, of course. There are also moments where new information, major volume, liquidity shocks or other disruptions make the market much harder to read. But underneath that, in certain conditions, price movement has deterministic qualities. It moves through oscillations that follow an underlying logic, and that logic can be studied, tested and understood.
That is the part most trading approaches miss.
They look at the visible marks on the chart and try to categorise them into patterns. We were trying to understand the market model that creates those marks in the first place. That meant separating what looked convincing from what could actually be connected back to the behaviour of price movement.
One way to think about this is through the idea of market 'languages'.
There's a limited amount of information the market can give us: price at different points in time, volume traded at different points in time, volume traded at different price levels, and in some markets, order book and order flow information. Different approaches try to interpret that information in different ways. Some are reading a genuine language of the market. Others are deriving meaning that isn't really there.
Fundamental analysis is one valid language because it compares market price with the perceived value of the asset. Order flow is another valid language because it reads what's happening in the order book and executed trades right now. The Duomo Market Theory is another language. It reads the oscillations in price movement and what those oscillations show us about the market's underlying dynamics: what has happened so far, where activity has changed, and where it may be more likely to change next. This gives us a way to decide which movements are meaningful and which are more likely to be noise.
That market model and theory of price movement is proprietary to us. It's our explanation for how price behaves when the market is moving according to its own inner mechanics, and it has been refined through testing and trading over time.
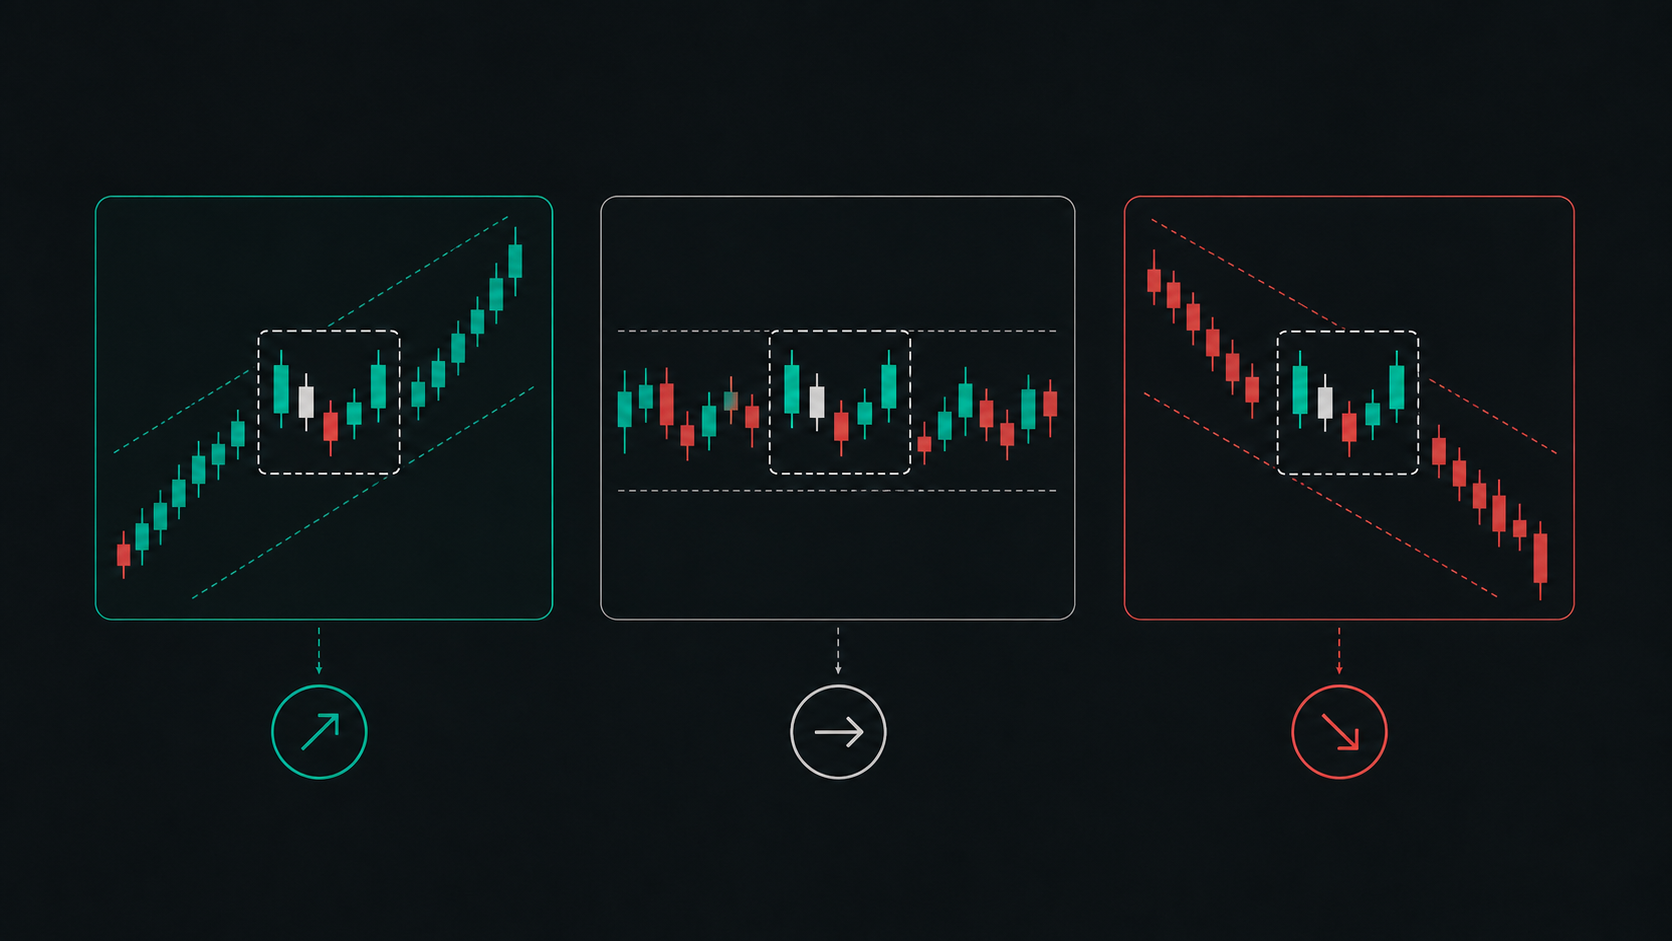
In the Duomo Market Theory, we separate market behaviour into two broad states:
Our main focus is steady state activity, because that's where price movement has more deterministic qualities. Herd activity is different. Something has disrupted the market's inner mechanics, so the market becomes much less predictable. That's why herd activity is something we want to be careful around, either by avoiding trades, reducing risk, or using filters that help us avoid lower-quality conditions.
The next part of the theory is the oscillatory nature of price movement. If the market were a perfect valuation machine, price would move directly to a new fair value whenever new information appeared, then barely move until the next piece of information arrived. But that isn't what we see. Price constantly oscillates.
Those oscillations are not just visual noise. They show similar behaviour features over time. Those features are also present across different scales, which is the Duomo Market Theory principle of scale invariance. If you remove the axes from a chart, the same broad types of price behaviour can appear across different time scales. When a system keeps showing the same properties under different conditions, it suggests there are underlying principles shaping the behaviour rather than every movement being random and disconnected.
That is what gave us something meaningful to work with.
If price moves in oscillations, and those oscillations are shaped by underlying market dynamics, then the important question becomes: where are those oscillations likely to turn, continue, or change characteristics?
Through the theory and extensive testing, we developed ways of identifying where those shifts in activity are more likely to occur.
The Duomo Market Theory is not claiming that every movement can be predicted. Steady state activity is a mix of both random and deterministic moments. But we have discovered how to identify times when it becomes deterministic, as a result of the market behaviour displaying a synchrony effect.
This is where significant levels come from. A significant level is not just a line where price happened to react before. It's a point or zone where, based on the Duomo Market Theory and the analysis methods derived from it, we expect a potential shift in activity. That shift may end an oscillation, continue it, or alter the probabilities of the next movement.
This is also where the idea of path of resistance becomes practical. If price is moving through imbalance, it will usually move via the path of least resistance until it reaches an area where activity changes. By uncovering the underlying model of price behaviour, we were able to develop analysis methods for finding where those areas are likely to be on the chart.
That is the bridge from Duomo Market Theory to the Duomo Method.
The theory gives us the market model: price is not purely random, steady state activity is more readable than herd activity, price moves through oscillations when the market is in synchrony, those oscillations show similar properties across scale, and shifts in activity change the path of price movement.
The Duomo Method turns that theory into a practical way of analysing the market. It gives us tools for identifying where those shifts in activity may occur, reading the surrounding context, anticipating meaningful outcomes and estimating probabilities.
So we aren't saying, "this pattern appeared, therefore price should do this." We are saying, "based on the market model we've uncovered and tested, this is an area where activity may change, this is what the current context is showing us, these are the meaningful outcomes, and these are the probabilities we can estimate."
This is an important point.
We aren't trying to predict every movement in the market. We're trying to identify the situations where the market is readable enough, the potential outcomes are meaningful enough, and the probabilities can be estimated accurately enough to justify taking risk.
Most traders are taught to ask, "Is my setup here?"
We're asking, "Is this situation one where the market is giving us enough meaningful information to form a reliable forecast?"
07
Context Is the Difference Between Information and Understanding
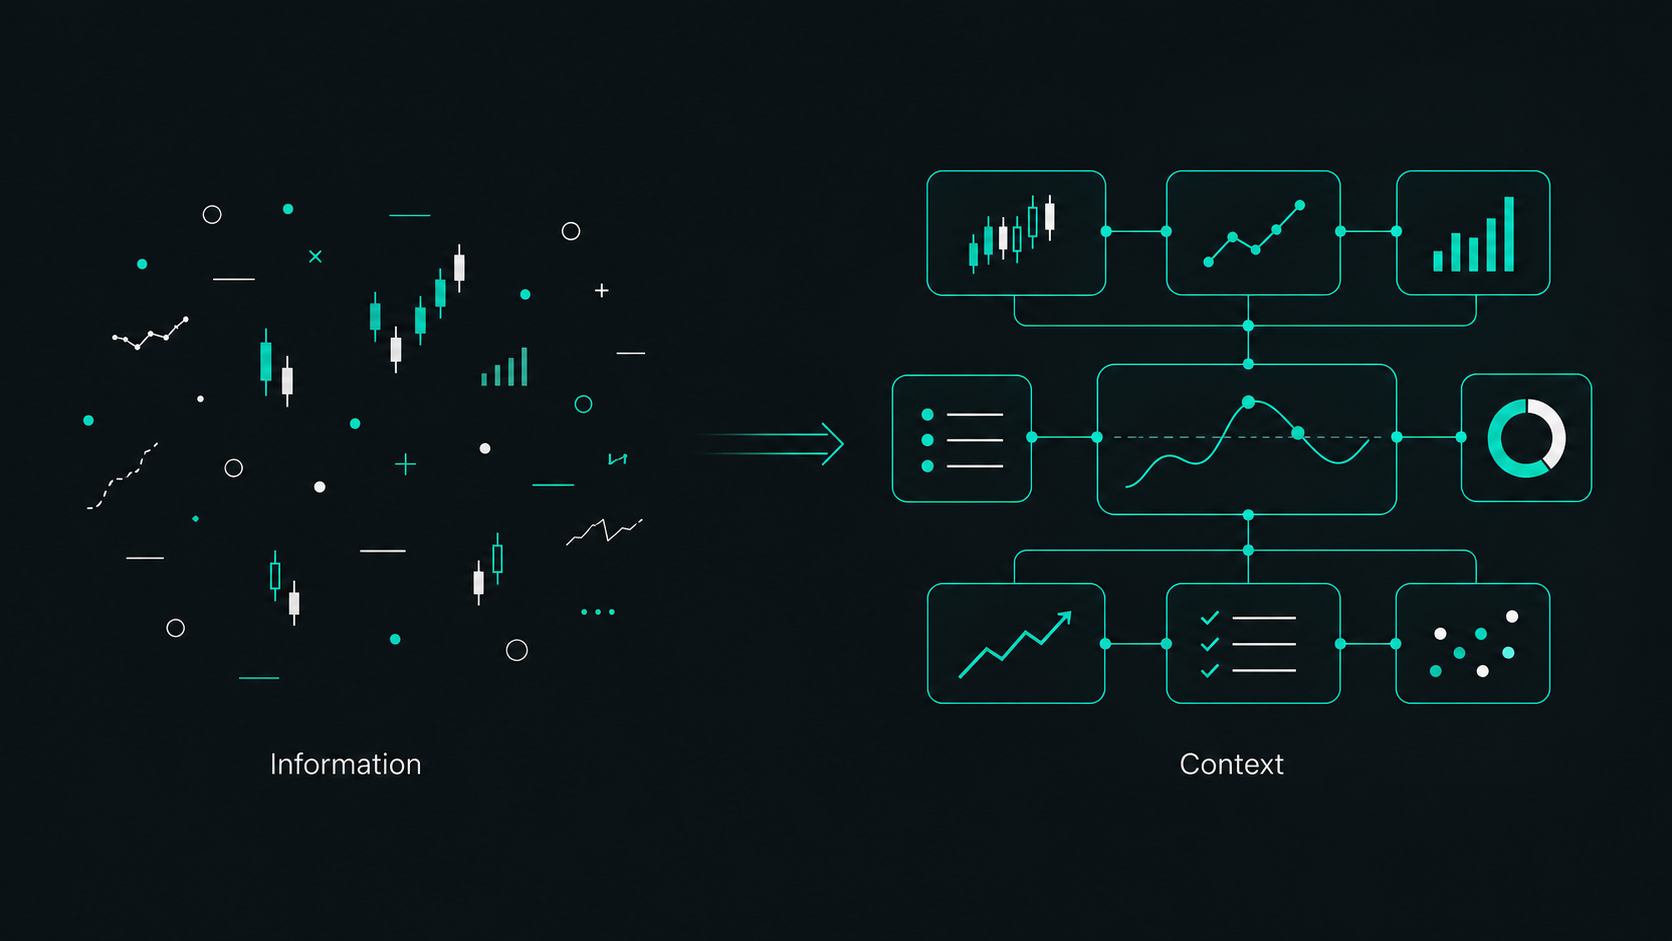
To understand what analysis should do, it helps to think in terms of a context hierarchy.
At the bottom of the hierarchy are individual transactions. From any single transaction, we only get a small amount of information: the price, the time, the quantity, and in some markets, what side of the book it executed against. That can tell us something about that one transaction, but not much about the market situation as a whole.
When transactions group together, they create market activity. This is where we start to see things like momentum, turning points, consolidation, breakouts, volume changes and shifts in behaviour. Activity gives us more meaning than individual transactions because it starts to show us what is happening in the market, not just what happened in one isolated moment.
But even activity is not the full picture. A single piece of activity can still be misleading if we treat it in isolation. Groups of activity together create the market context. Context is where the information becomes meaningful because we can see how different parts of the market situation relate to each other.
The purpose of analysis is to move up that hierarchy: from raw information, to context, to a forecast.
Think of market information like language. A word can tell you something, but not much. A sentence tells you more. A paragraph gives you context. If you only memorise phrases, you might sound fluent in simple situations, but you will not understand the conversation when the context changes.
This is what happens with many trading approaches.
They teach traders phrases. A pattern. A setup. A signal. A rule.
But the market is like an ongoing narrative, not a series of isolated words.
The same visible cue can mean different things in different situations. A rejection at a level can mean one thing if the move into it was weak and stretched, another thing if the move into it was strong, another thing if volume is surging, another thing if price has just broken through a key area, and another thing if a major economic release is about to hit the market.
Context changes meaning.
In the Duomo Method, context is built from the combination of different contextual factors. None of these should be treated in isolation.
If you exclude one part of the context, you're trying to understand the paragraph with some of the words missing. You might still reach a conclusion, but you are much more likely to misunderstand what is being said.
This is why analysis isn't just spotting, plotting and labelling things on a chart.
Spotting, plotting and labelling collect information. The investigator role has to connect that information and interpret what it means. The output should be a forecast: meaningful outcomes and probability estimates.
That's the point of analysis.
08
Significant Levels Give Us Meaningful Outcomes
If trading is about expectancy, we need potential outcomes.
But the outcomes can't be vague.
"Price might go up" isn't an outcome. How far up? To what point? What happens if it gets there? Would the context change? What would invalidate the move? Where is the negative outcome? What is the base rate between those points?
The outcomes also can't be arbitrary.
If a trader chooses a target just because it creates a 1:3 risk-reward ratio, that target may have nothing to do with the market. It is a number imposed on the chart. The market does not care what ratio the trader wants.
So where should outcomes come from?
They should come from the points where activity is likely to change.
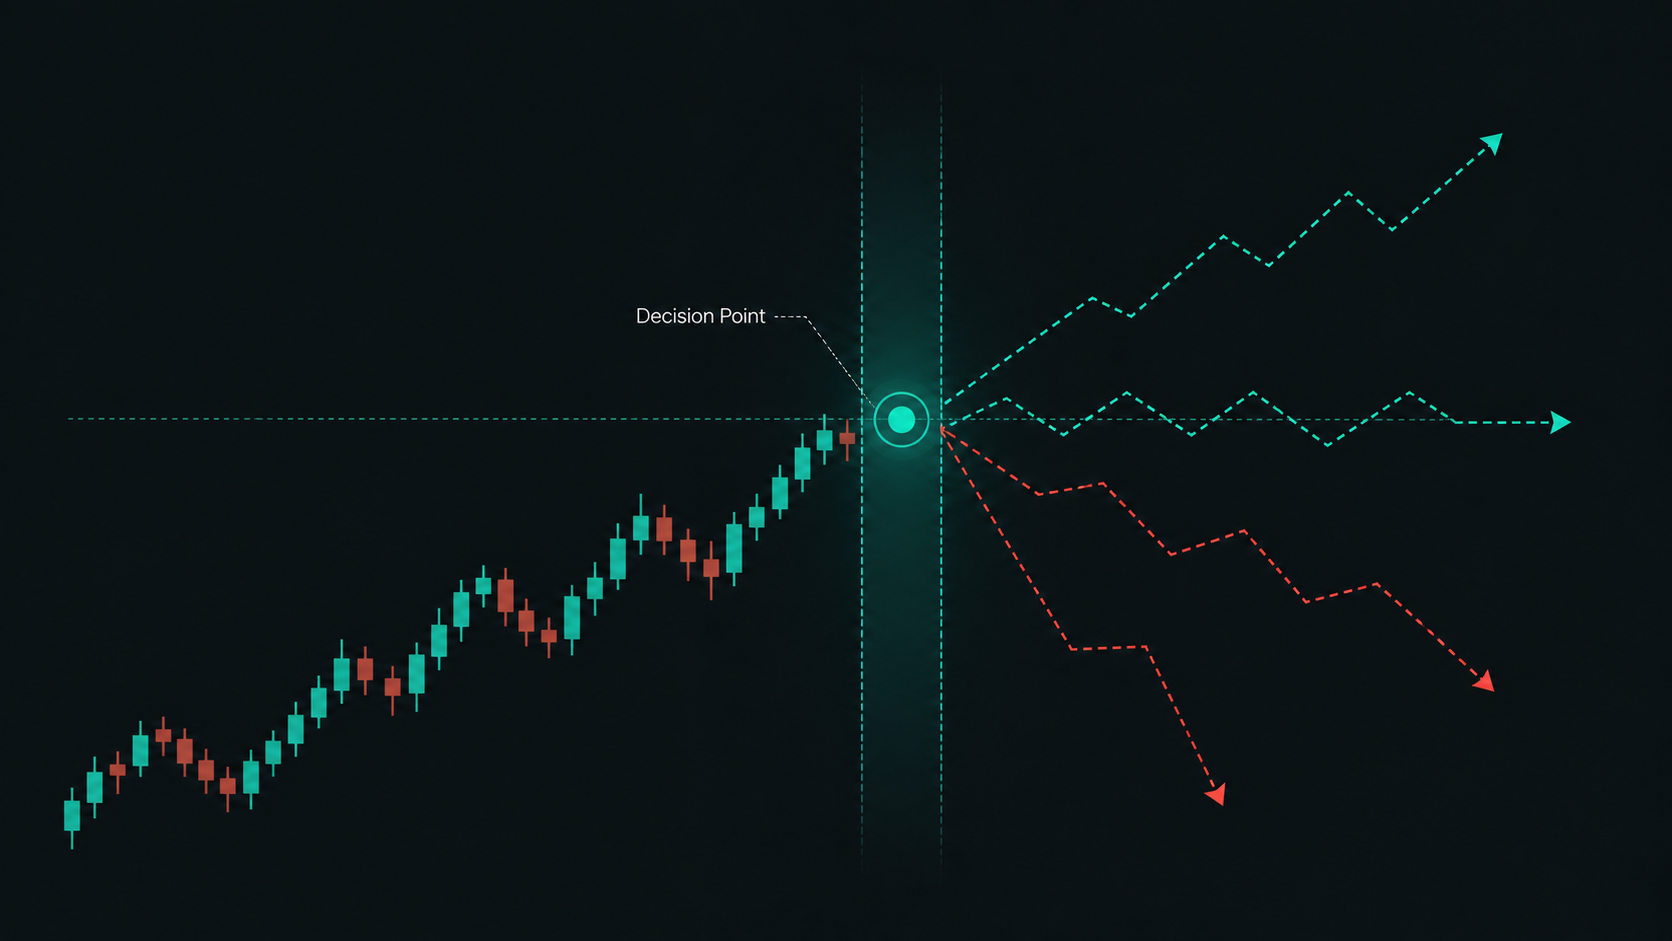
That's the role of significant levels.
A significant level is a price point or zone where we expect a change in activity to occur. Because price moves through imbalances between volume and liquidity, a move is likely to change when something changes that imbalance. Significant levels help us anticipate where that may happen.
This doesn't mean price must reverse at a significant level. That would be the wrong way to think about it.
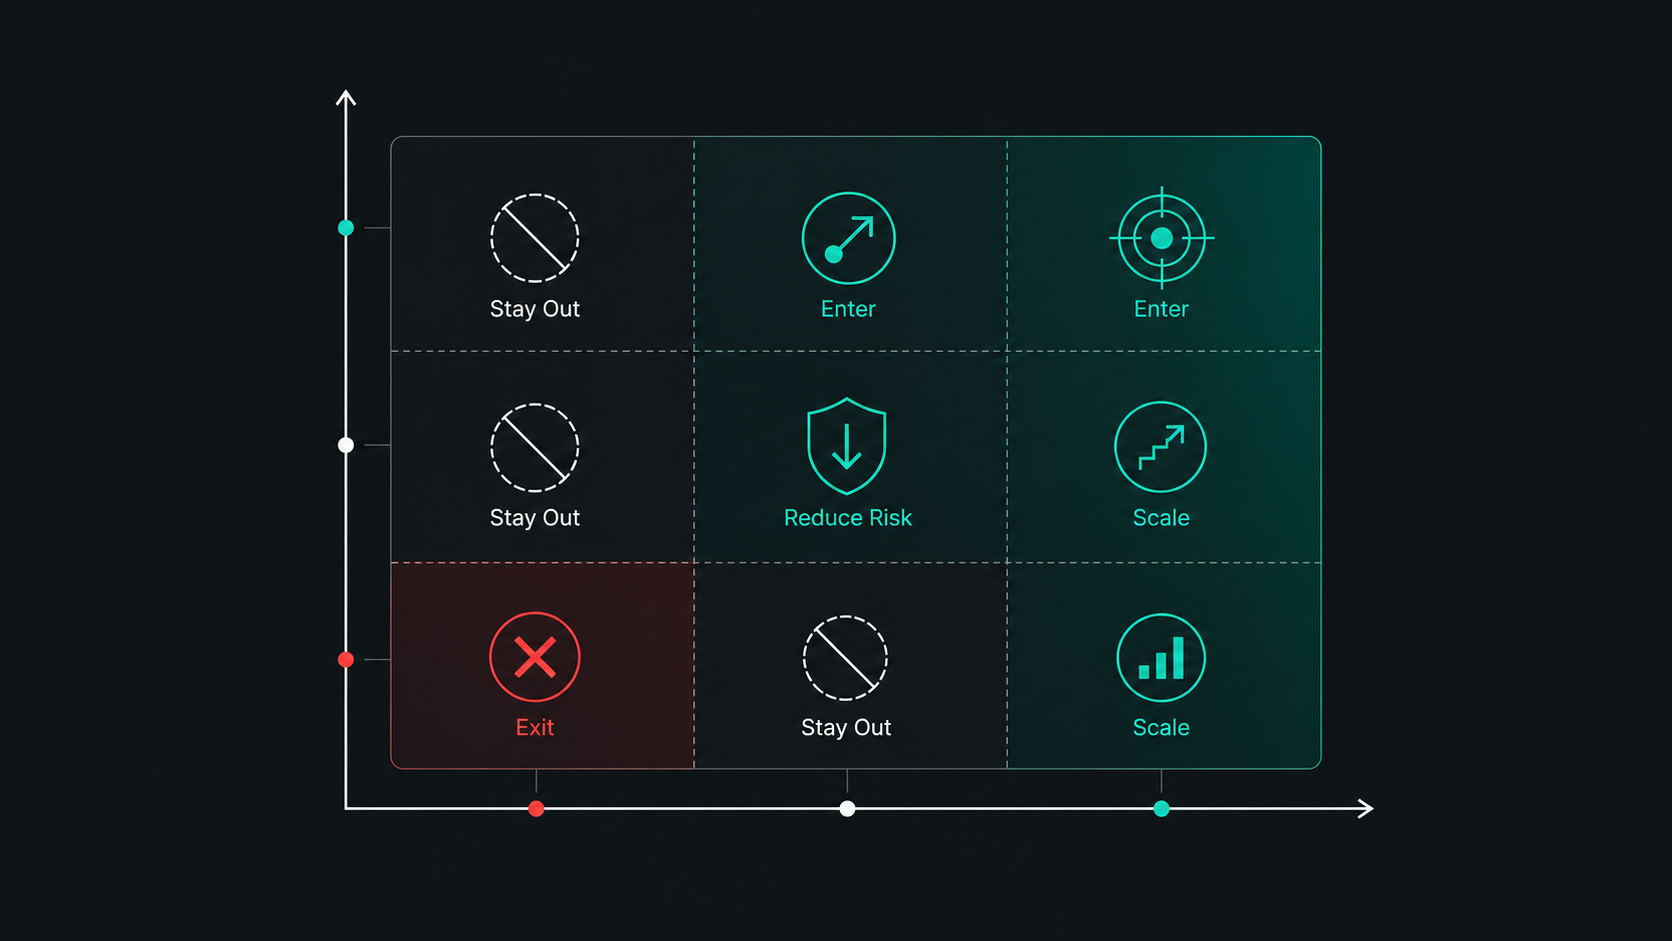
The level creates a point where activity may change. Depending on the context, that change could create a reversal, consolidation, continuation, breakout, or a shift in probabilities. The level is not a prediction by itself. It is a decision point that becomes meaningful when interpreted through context.
This is why significant levels are so central to our approach.
They create the structure for the forecast.
They allow us to define first-order outcomes, meaning the immediate meaningful outcomes in each direction. They also allow us to think about second-order and higher-order outcomes, meaning what may become relevant after the first outcome is reached.
This is similar to scenario planning. We aren't pretending there's only one possible future. We're laying out the meaningful paths the market could potentially take, then assigning probabilities based on the information we have.
Once price reaches a decision point, the context updates. What was previously a second-order outcome may become the new first-order outcome. The probability estimate changes because the information has changed.
This is why set-and-forget trading often makes the wrong statement about the market.
If you place a take profit at the time you're entering a trade, you're effectively saying that when price reaches that point, you should be out of the trade regardless of the context at that time. But what if price reaches the level with strong momentum and the next outcome has positive expectancy? What if the original target was simply the first decision point, not the end of the opportunity?
Likewise, if you stubbornly hold through a change in context which has a negative impact on your forecast, you're making a different wrong statement. You are acting as if the original forecast is still valid when the market has given you new information.
The Duomo approach avoids this by treating significant levels as decision points rather than static targets.
09
Probability Estimates Must Come From Context
Once potential outcomes are defined, the next step is estimating probabilities.
This is where a lot of traders become uncomfortable because they assume probability estimates are just guesses. But every trader is already making probability judgements whether they realise it or not.
If you take a trade, you're saying the probability of the profitable outcome is better than the base rate. We already covered the logic earlier: you wouldn't take a random 1:1 trade because there is no advantage. So if you wouldn't take that random trade, but you are willing to take this trade, the statement you're making is that the current situation gives you an advantage over the base rate.
The difference is whether you make those judgements consciously and improve them, or whether you make them vaguely and hope for the best.
At Duomo, probability starts with the base rate.
Then we adjust based on meaningful contextual variables.
Those variables shouldn't be random things we happen to identify on a chart. They need to have a logical reason to affect probability. They need to tell us something about the activity in the market.
This is a very different process from applying a fixed success rate to a setup. A fixed success rate treats all examples as if they share the same context. A context-based probability estimate recognises that every situation is unique, even if some features look similar.
The goal isn't to be perfectly accurate on every trade. That's impossible.
The goal is to become accurate enough, over a large enough sample size, that your estimates reliably identify positive expectancy opportunities.
That doesn't mean pretending you can know the probability to the exact percentage from day one. It means building the skill. At first, estimates may feel rough. Over time, as you collect data and go through a calibration process, the estimates become more consistent and more accurate.
This is how forecasting improves in other fields. It's how it should improve in trading too.
10
Strategy Is the Response to the Forecast
Most traders are taught that strategy is the key to successful trading.
So everything starts to revolve around finding the right strategy, learning the rules, sticking to them, managing risk and fixing the psychology problems that stop them following it properly.
But this puts strategy in the wrong place.
The common view is that a strategy is a pre-defined set of rules that tells the trader when to enter, where to place a stop, where to take profit and how to manage the trade. The trader then brings that strategy to the market and looks for situations where it can be applied.
That sounds practical, but it doesn't align with good strategic principles.
In any serious field, strategy begins with diagnosis. You understand the situation first. You identify the critical factors. Then you decide what action makes sense in response to those factors.
You don't bring a fixed solution to the market and look for places to apply it. That is backwards. It's like deciding the treatment before diagnosing the patient, or deciding the business plan before understanding the problem the business is trying to solve.
In trading, the diagnosis is the analysis and forecast. It is the understanding of context, potential outcomes, probabilities and expectancy.
Strategy comes after that.
In our framework, strategy is the process of turning a positive expectancy opportunity into a well-managed trade. It's a form of strategic risk management.
Every action makes an implicit statement.
Your entry says the opportunity has positive expectancy.
Your stop loss says that beyond this point, the trade no longer has positive expectancy.
Your position size says this is the amount of risk justified by the expectancy and uncertainty.
Your first profitable decision point says this is where the next meaningful reassessment should happen.
Scaling in says expectancy has improved enough to justify adding risk.
Scaling out says expectancy has decreased enough to justify reducing exposure.
Exiting says the opportunity no longer has positive expectancy.
If your actions don't match the statements you intend to make, your strategy is working against you.
This is one of the reasons some traders can identify decent opportunities and still fail to achieve good results. They turn positive expectancy opportunities into poor trades through bad strategic decisions.
They use arbitrary stops. They target arbitrary ratios. They close trades because they feel uncomfortable. They hold trades because they don't want to be wrong. They move stops for emotional relief. They scale in because they're excited. They scale out because they're scared. They enter because a setup appeared, even though the context doesn't justify it.
The Duomo approach ties the action back to the forecast. That makes the decision-making logical, consistent, and well-defined.
11
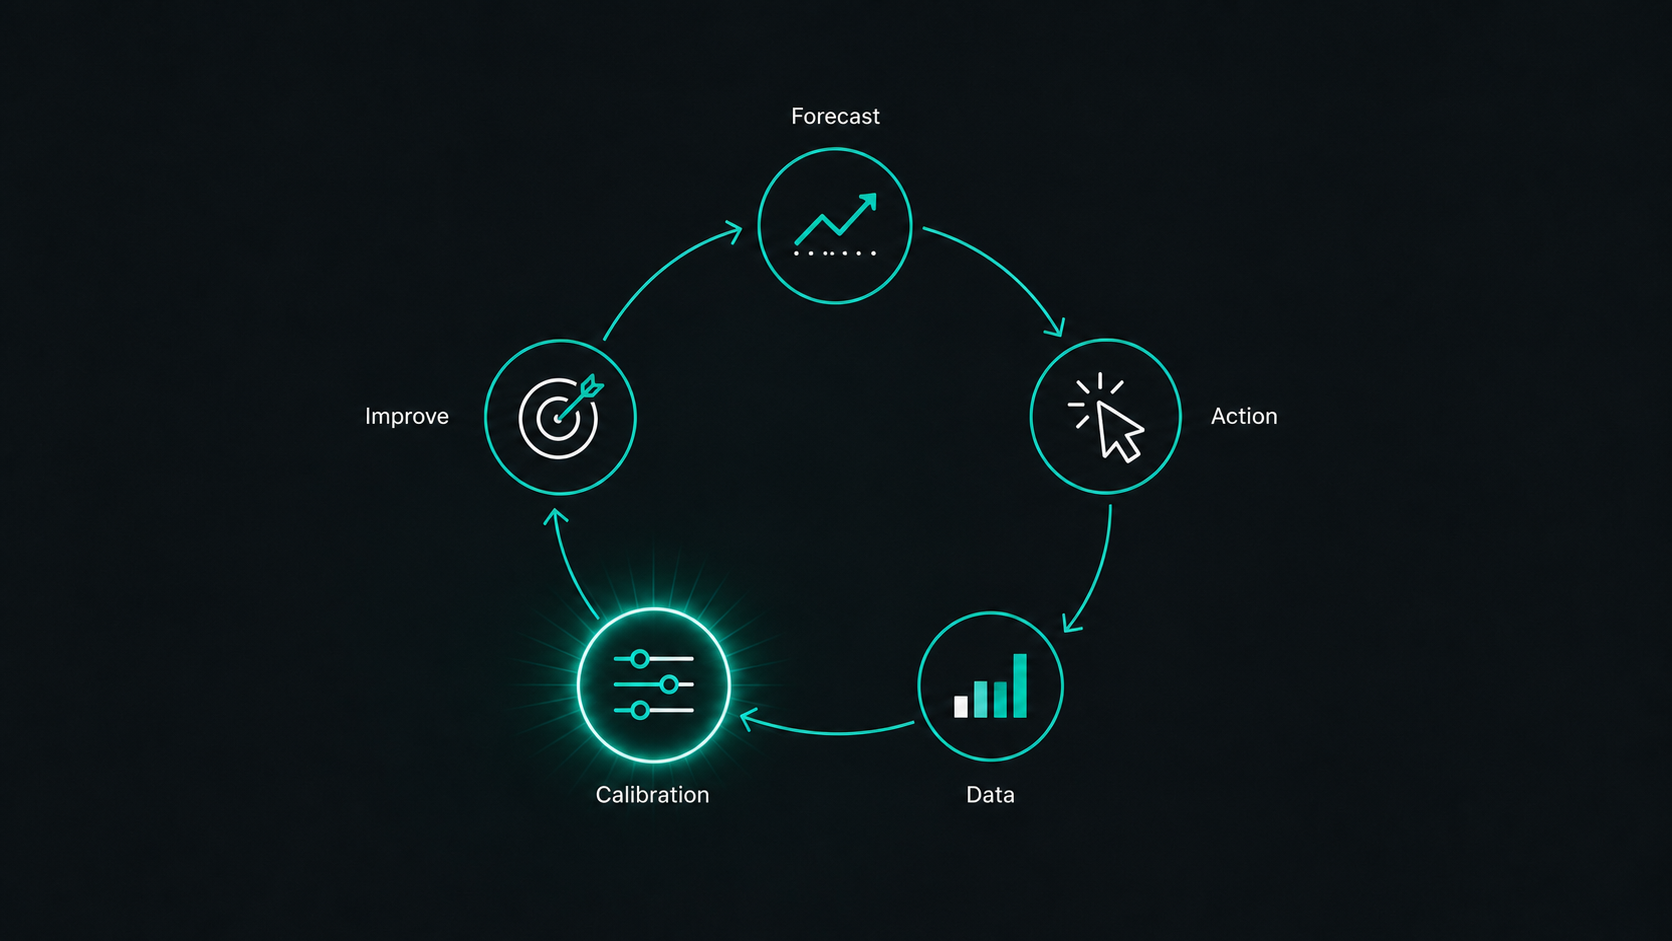
Calibration Completes the Flywheel
If trading is a forecasting skill, improvement has to involve calibration.
Journalling isn't enough if it only records what happened, your actions, and how you felt. That is still useful, but it doesn't tell you whether your estimates were accurate.
Calibration means comparing your forecasts with what actually happened across a meaningful sample size, and then making adjustments to fine-tune your future approach.
If you estimate a group of outcomes at 60%, do they happen roughly 60% of the time? If not, are you overconfident or underconfident? Are you accurate in certain contexts but not others? Do some variables improve your estimates while others add noise? Are some of your analysis elements actually doing nothing? Are you better at identifying outcomes than estimating probabilities? Are your forecasts good but your strategic decisions poor?
This is where progress becomes inevitable.
The analyst collects meaningful information about market activity.
The investigator turns that information into a forecast.
The strategist expresses that forecast through action.
The calibrator reviews the data and improves the process.
Then the cycle repeats.
That's the flywheel.
Without calibration, traders are usually guessing what to improve. With calibration, they can start separating course corrections from skill gaps.
A course correction means the trader is broadly reading the right information, but the estimates need adjusting. Maybe they are consistently overestimating a particular contextual factor. Maybe they are underestimating a particular structure characteristic. That can be recalibrated.
A skill gap means the trader isn't reading the situation properly, or the variable they're using has no meaningful predictive power. In that case, the answer is not a small adjustment. They need to develop the skill properly or remove that element from the model.
This is what most traders are missing.
They can't improve reliably because they can't see what's actually causing their results. They can only see the final profit or loss, which is often too noisy to be useful.
At Duomo, we want traders to be able to assess the moving parts.
What contributed to the forecast? What contributed to the action? What contributed to the outcome? What can be improved? What should be removed? What is genuinely giving an edge?
That's how trading becomes a skill development process rather than a Random Results Treadmill.
12
Psychology Improves When There Is Logic and Evidence
A lot of trading psychology problems are real, but they're often misunderstood.
Traders are told they need more discipline, better emotional control, more patience, more confidence, or a stronger mindset. Sometimes that's true. But many psychological problems are symptoms rather than the root cause. The real problem often comes from an illogical or inappropriate trading approach.
If you're trying to predict whether a trade will result in a profit when deciding whether to enter, of course you'll hesitate. You're trying to achieve certainty in a situation that relies on probabilities.
If your trade management decisions are not rooted in logic, of course you'll make arbitrary decisions based on how you feel.
If you judge losses as failures, of course you'll become loss averse and avoid taking them at all costs.
If your strategy is a rigid sequence, of course you'll feel conflicted when the context changes.
The solution isn't to try and force yourself to feel less.
The solution is to build a process where the right action is clearer, and where the trader has evidence that they can rely on it.
That evidence cannot come from short-term profit and loss alone. Profit is too unreliable in small sample sizes. A trader can make money from a poor decision and lose money from a good decision. They can have a profitable week because they were lucky, or a losing week while trading with an edge.
So if profit is the only evidence they have, their confidence will rise and fall with randomness.
This is why probability estimates and calibration are so important. If a trader estimates probabilities and then compares those estimates with what happens across a large enough sample size, they start to build evidence of whether their read on the market is accurate enough.
If you were betting on a coin flip, where you lose £10 on heads, but win £20 on tails, would you hesitate to keep playing if you lost several times in a row?
Probably not. You'd understand that short-term outcomes can go against you even when the expectancy is still in your favour. The key is knowing the potential outcomes and probabilities, and having evidence that things are still in your favour. Having confidence in your edge.
Trading is more complex than a coin flip, but the principle is the same. Without evidence, the trader is trying to trust something they can't properly verify. With evidence, they can relate to uncertainty differently.
When you know the potential outcomes, the probability estimates, the expectancy, the next decision points, the conditions that would change the forecast and the evidence behind the model, you're not relying as much on emotional improvisation. In fact, neuroscience shows that your brain actually processes situations more rationally and less emotionally when the probabilities are understood.
Real trading psychology problems do exist. Traders do experience fear, hesitation, impulsiveness, loss aversion, overconfidence, revenge trading, avoidance and anxiety under uncertainty. Those problems shouldn't be dismissed.
But they also shouldn't be handled through received wisdom, motivational slogans or the pseudoscience that's so common in the industry.
If we want to deal with trading psychology properly, we need to understand how the brain works. A trader is making decisions under uncertainty, with money at risk, while processing constantly changing information. That involves attention, memory, threat detection, reward processing, emotional regulation, cognitive bias and the nervous system's response to uncertainty and loss.
So the question isn't just, "How do I become more disciplined?"
The better question is, "What is causing this problem?"
Different problems need different solutions. And they need to be grounded in scientific research into decision-making, learning, uncertainty, emotion, stress, attention and behaviour.
Neuroscience gives us a much better way to think about the problem. A trader is not a perfectly rational machine trying to "control emotions". They are a human being making high-pressure decisions while the brain is processing threat, reward, uncertainty, memory and prediction. If we want better trading psychology, we have to understand those mechanisms and then use evidence-based tools that are designed around them.
The answer isn't to repeat industry phrases like "control your emotions", "trust the process" or "fix your mindset". Those phrases might sound useful, but they usually don't explain what is happening or how to change it. The better approach is to identify the mechanism behind the problem, then use the right tool for that mechanism.
Where deeper psychology problems remain, they should be dealt with through science-based solutions from fields like neuroscience, psychology, behavioural science and skill acquisition, not received wisdom from an industry that often doesn't understand the brain in the first place.
13
What This Means for Learning Trading
Once trading is understood in that way, the learning problem changes as well.
Most traders are told that success comes from finding the right strategy. They believe the main task is to discover the right set of rules, memorise the pattern, apply it consistently, and wait for the profits to follow.
In other words, trading education is often treated like information transfer.
Learn the rules. Copy the examples. Follow the steps.
That is not how real skill works.
Trading is a skill. More specifically, it is a group of connected skills: reading market activity, understanding context, estimating probabilities, forming forecasts, expressing those forecasts through strategy, managing risk, reviewing decisions, calibrating estimates and regulating your own behaviour under uncertainty.
You cannot develop those skills properly by memorising a strategy in the way you might apply a business model or memorise a simple set of instructions.
You develop them through the conditions that skill acquisition research repeatedly points towards: clear mental models, structured practice, repetition, feedback, correction, increasing complexity, and the ability to connect new ideas to what you already understand.
That is where purposeful and deliberate practice becomes important.
A trader needs to practise the right things, in the right order, with feedback that tells them what is improving and what is not. Repetition alone is not enough. If someone repeats the wrong process, they only become more fluent at doing the wrong thing. Practice has to be structured around the skills that actually drive performance.
This is one of the reasons the learning environment is so important.
If a trader is left alone with a strategy and a chart, they usually start judging everything by short-term outcomes. They make money and assume they did something right. They lose money and assume they did something wrong. They change rules, blame discipline, and get pulled back into the Random Results Treadmill.
A proper learning environment should make the invisible parts of the skill visible.
It should help the trader understand why a piece of analysis is relevant, what it contributes to the forecast, how it affects probability, how it should influence the strategic response, and how the result should be reviewed afterwards.
That is why our curriculum is not built around handing over a strategy and telling traders to follow it.
It is built around skill development. We use structured progression, deliberate practice, repetition, feedback and constructivist learning principles, where learners build understanding through structured experience rather than passively receiving information. Traders are not just collecting information. They are building the mental models and practical abilities needed to understand the market for themselves.
The goal is not for a trader to memorise what we would do in a particular situation.
The goal is for them to develop the skill to understand what the situation is, what it means, what the probabilities look like, and what actions make logical sense.
That takes time. There is no honest way around that.
But if trading is a real skill, then taking the time to develop it properly is not a weakness in the approach. It is the only approach that makes sense.
That is why the Duomo approach is not only a market model, but a learning model.
14
Conclusion
The Duomo approach begins with a chain of logic.
If price moves because of imbalances between volume and liquidity, then traders need to understand the activity that creates and changes those imbalances.
If price movement changes when activity changes, then traders need a way to identify where those shifts in activity are likely to occur.
If those shifts create meaningful potential outcomes, then significant levels become central to analysis.
If trading outcomes are probabilistic, then traders need to estimate probabilities rather than rely on certainty, setups, or fixed success rates.
If probabilities only have meaning in relation to the base rate, then risk-reward ratios and a high percentage of profitable trades do not mean much in isolation.
If probability estimates depend on context, then analysis must be about understanding context rather than just spotting, plotting and labelling things on a chart.
If a trade is only worth taking when it has positive expectancy, then the purpose of analysis is to produce a forecast that allows us to determine expectancy.
If every action makes an implicit statement, then strategy must make the right statements about the forecast.
If short-term results can be luck, then progress must be measured through forecast accuracy, calibration and large enough samples.
And if all of that is true, then learning to trade cannot be about memorising a setup or copying a strategy.
It has to be a skill development process.
That is what the CTM, the Duomo Market Theory and the Duomo Method are designed to support. The CTM gives the overall operating system. The Duomo Market Theory gives the proprietary theory for why price movement can be read in the way we read it. The Duomo Method gives the practical tools for applying that theory in the market.
Most traders struggle because they're taught to focus on the wrong things. They're told to search for strategies before they understand the markets. They are taught setups before context. They are taught risk-reward ratios before probabilities. They are taught discipline before decision-making. They are taught to judge results before they understand randomness.
Our aim is to put those pieces back in the right order.
When trading is aligned with the right logic, the role becomes clearer.
You know what you're trying to forecast. You know what information is relevant. You know what would create an edge. You know what action should express the view. You know what to track. You know how to improve.
That is what serious trading education should provide.
Not an unreliable strategy or a way of spotting setups.
A logical model for developing real trading skill.
Cookie preferences
Choose which categories of cookies you'd like to allow.
You can change this at any time from the "Manage cookies" link in the footer.