
If you aren’t a member of the Duomo Trader Development Program, you may not be able to follow everything clearly. But if you’d like to learn how to analyse markets in this way, interpreting context, finding valid opportunities, and planning appropriate strategies, you can find out more about DTDP here.
Market Selection
EUR/CAD made it onto my watchlist for the day because the previous day closed as a single confirmation at a major daily path of resistance that price had previously struggled to break with more aggressive activity than the current move.
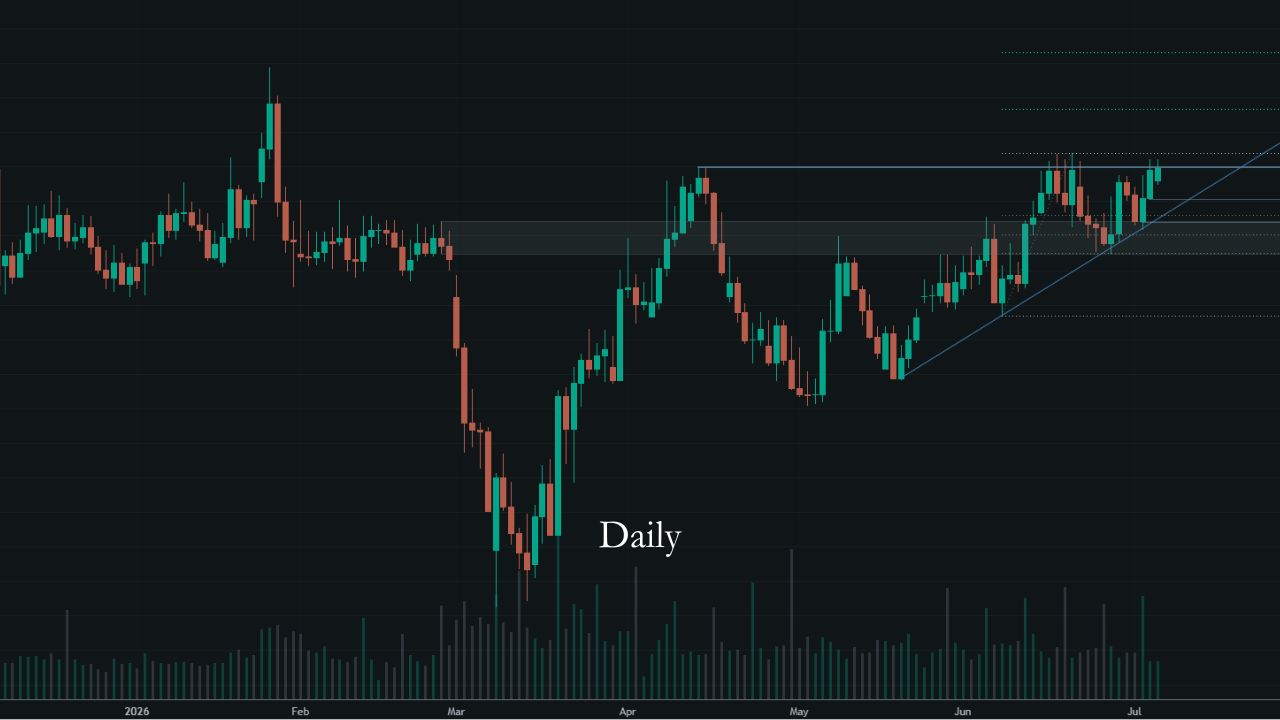
This meant there were two broad things that could happen, which could both offer opportunities:
Scenario 1: If things stay as they are, a bearish reversal would be likely.
Scenario 2: For a bullish break of the area, we’d need a change in dynamics with more aggressive participation coming in. If that happened, once it cleared the level there would be potential for a huge bullish imbalance.
There was also a good chance of consolidation in the short-term, which would be beneficial from a strategic point of view for anticipating a scenario 1 opportunity.
Analysis
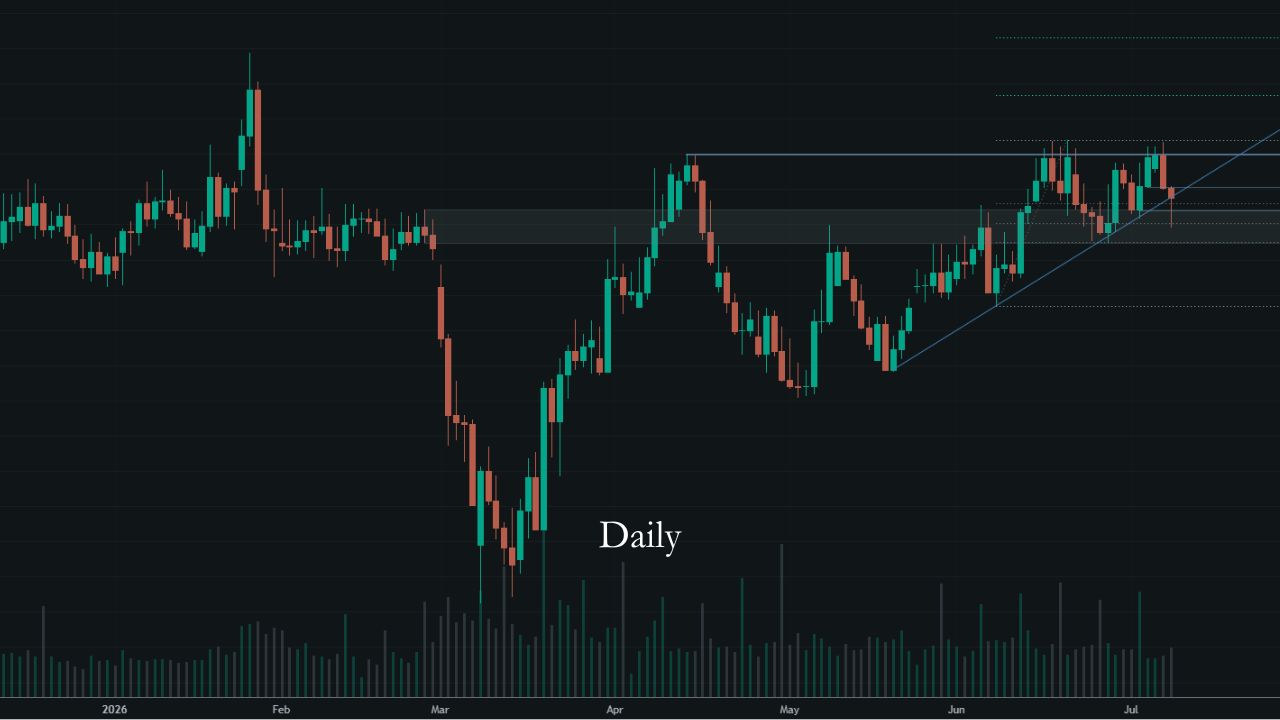
Daily chart
At the time of the opportunity, the price had moved through the daily path of resistance, but it lacked conviction and was still technically in a single confirmation setup from the previous day.
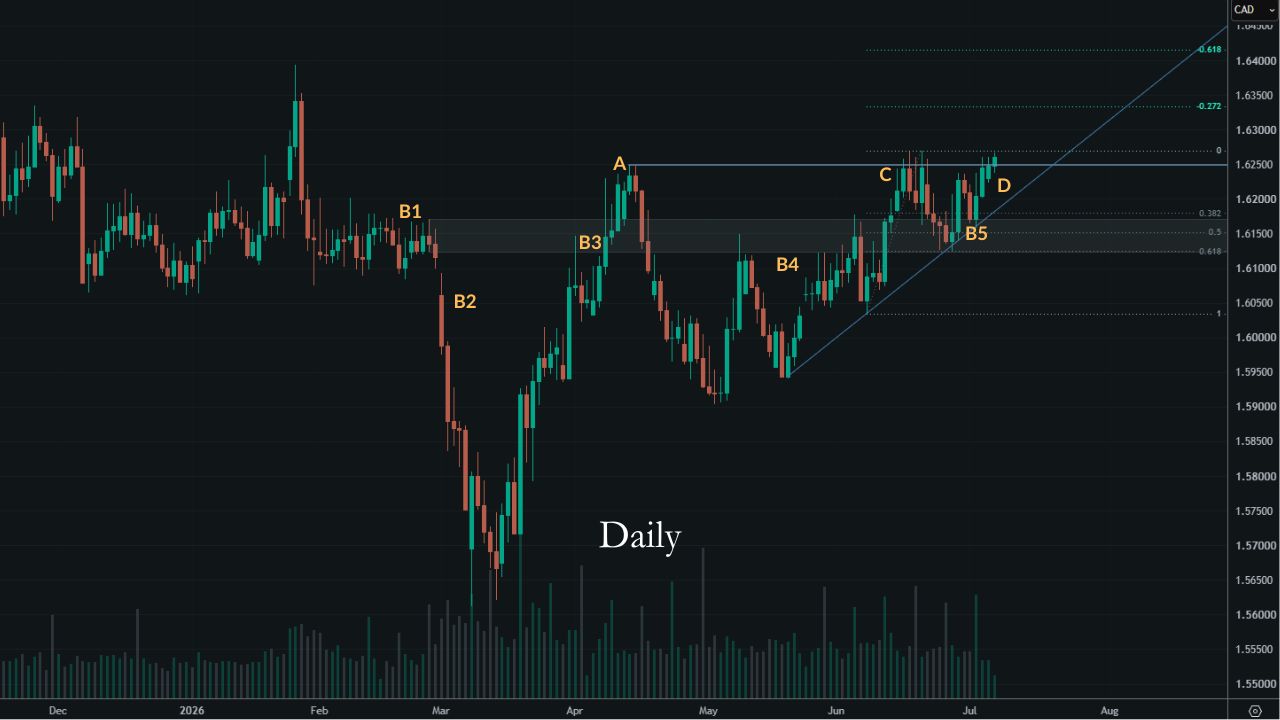
There are a few things to note here (labelled on the screenshot):
A: The path of resistance is clearly strong, as it’s a macro time horizon high following a sustained, direct move.
B: The zone is also strong, as evidenced in a number of ways: 1) Prolonged consolidation in the build-up to the break lower, 2) major imbalance in the break lower that was sustained, 3) clear major shift in activity during the strong, sustained bullish move, 4) several reversals from standard moves, 5) bigger shift in activity eventually needed to break through the zone.
C: Since we know the zone is strong, the move through it must have had good participation. But it fails at the path of resistance (mentioned in point A), therefore reinforcing the strength of the level that price is currently interacting with.
D: Since we assume there should be a strong shift in activity at the zone, the most recent bullish move should have more conviction, but it’s low activity even before reaching the path of resistance. This shows us that bullish participation/conviction has started to decline.
In terms of the potential outcomes, the bearish move would be towards the trend line / zone, and the bullish move would be towards the 127.2. At the moment, there would be a slight advantage over the base rate for the bearish outcome, but we can go to the lower time frames to investigate further.
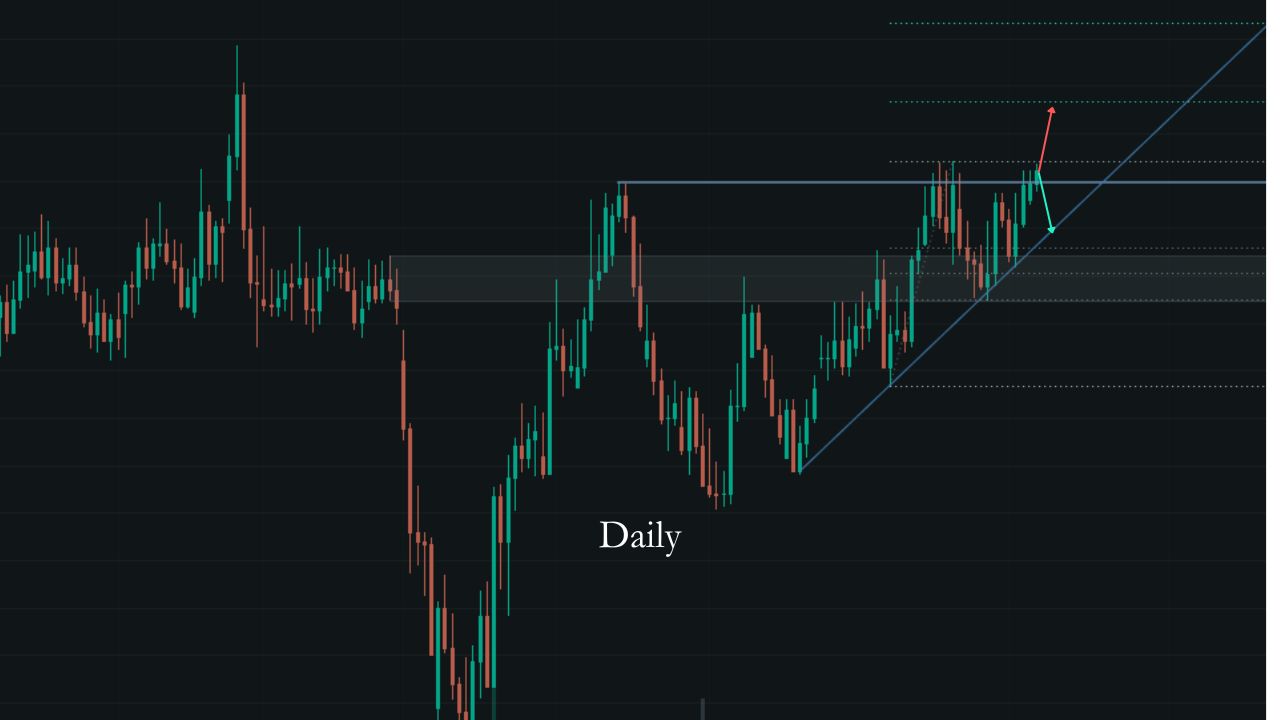
It seems we are looking at a typical ‘overcome’ situation, where the shift in activity at the major path of resistance is being offset by aggressive bullish participation in the move towards it. We can explore this further to validate this, look for signs of any advantage, and identify what contextual factors would be most important for anticipating a change in context.
4-hour chart
Broadly, we see a compressing market. The key thing that stands out is how the activity has faded out in recent interactions. We can look at the cause-effect sequence to understand the overall context.
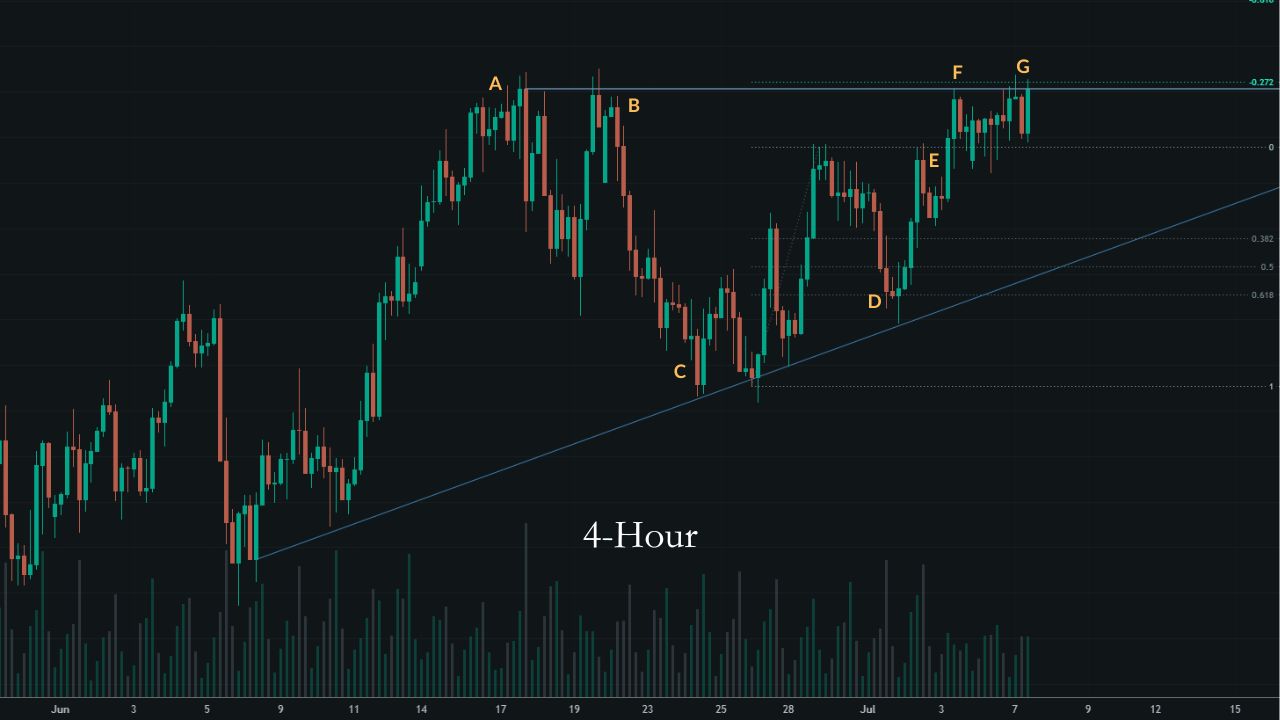
(Labelled on screenshot)
A: The sustained bullish move initially creates the high. The reversal starts with a strong imbalance and retraces half of the move towards it. This is a strong level.
B: Despite strong bullish activity coming into the level, we get a strong reversal and a direct move that entirely retraces the bullish move and breaks to a lower low, creating short-term bearish structure.
C: The bearish activity fades out, rather than being overcome with a strong reversal. Bullish structure begins, which creates the end of the macro wave and allows us to plot an unconfirmed trend line.
D: A deep retracement means there’s weakening bearish structure, but it’s reversed at the unconfirmed trend line, which then confirms it.
E: The initial move from the trend line shows decent bullish activity, similar to the previous leg, but struggles at the previous swing high, before eventually overcoming it. However, there isn’t enough activity behind the move to overcome the shift in activity at the dominant swing high.
F: As this is the dominant path of resistance, we would expect a bigger reaction than this. It struggles to break the short-term swing high, which is the less dominant path of resistance. Price consolidates.
G: We fail as a double confirmation of the 127.2 and major swing high. The entry candle shows a good initial reaction, but it’s not sustained and price returns back to the major high.
Overall, the signs are that there isn’t enough aggressive bullish activity to break the major levels above. However, right now we’re also not seeing much of a reaction to the shift in activity at these levels. This may be because the bullish move is still supported, or that the level has become less significant and prices are simply being accepted in this area.
With that in mind, we can assume that the path of least resistance is (at the very least) a move back towards the short-term swing. Considering this is a dominant path of resistance above (referring back to the daily chart), we can also assume that with the current context, the higher order outcomes are also eventually a bearish advantage.
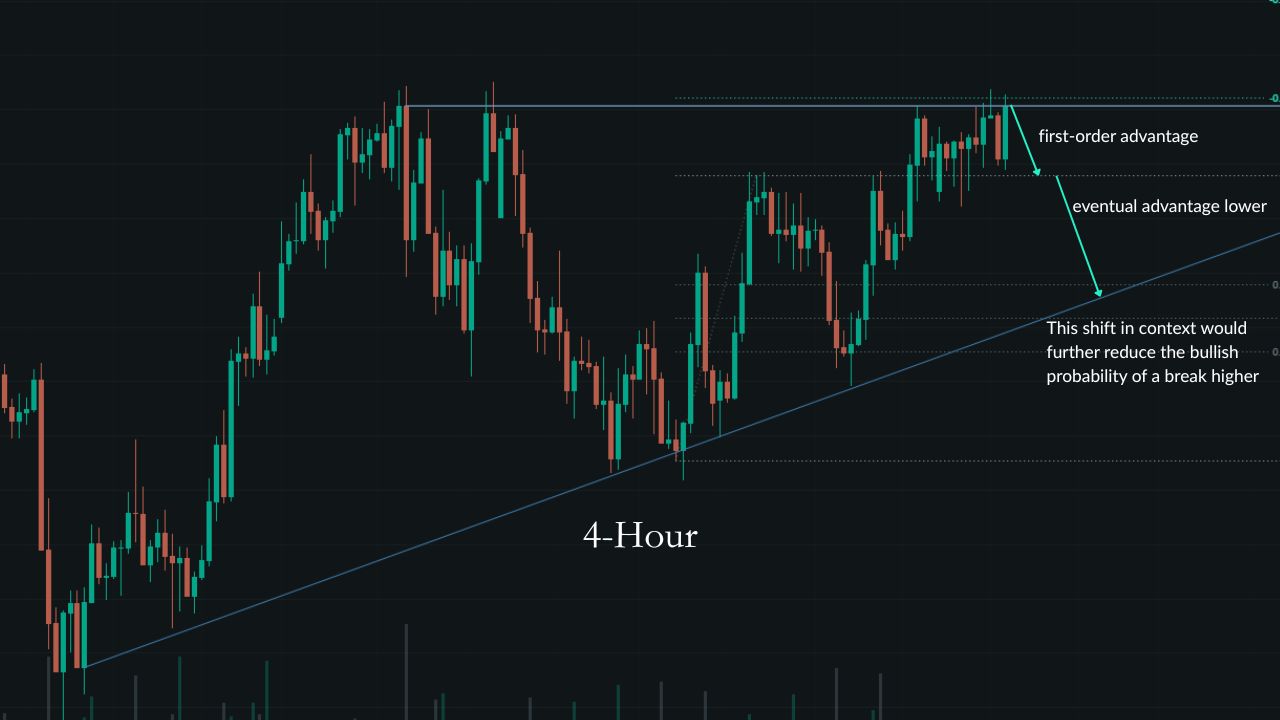
Therefore, we currently have positive expectancy for bearish outcomes, giving us a valid opportunity. We can now drop to the lower time frames to refine it.
1-hour chart
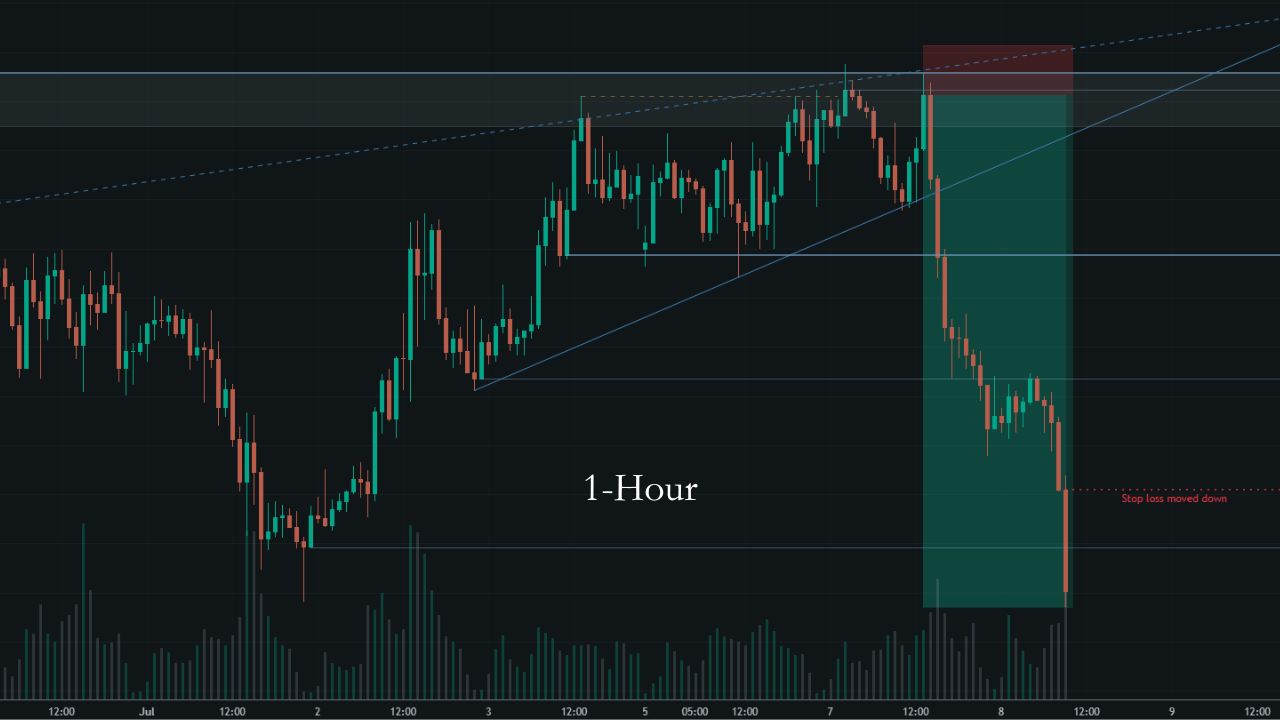
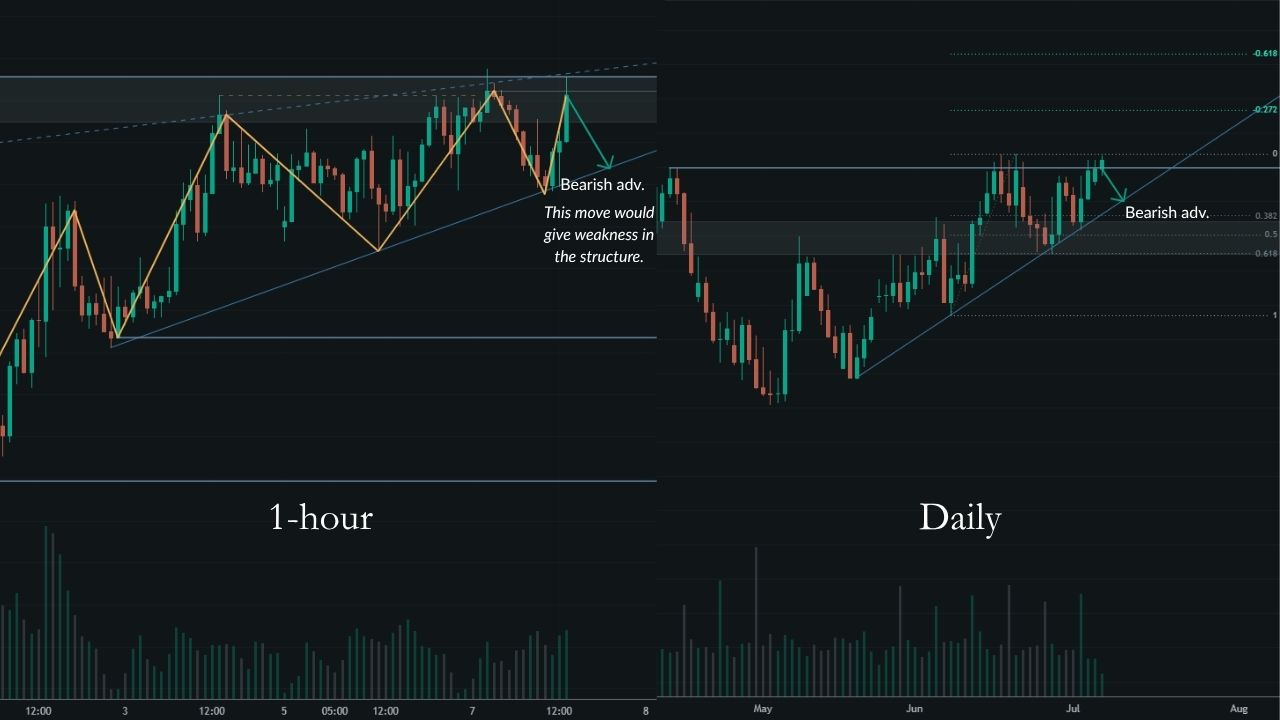
We have a number of additional paths of resistance that are reducing the chance of moves higher.
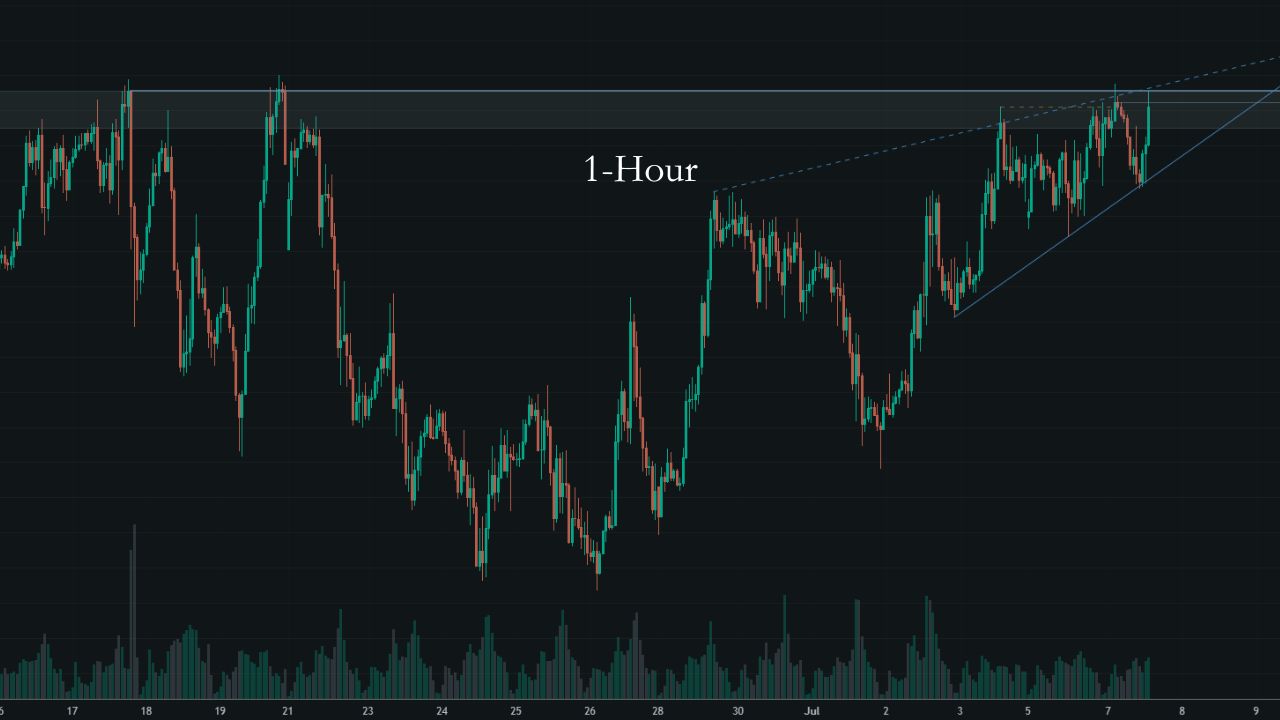
- We have the major swing high, which has been very precise. The current candle is failing at that level as a Type 1.
- We can also consider that it may be a zone instead of just a swing high, due to the activity we’ve seen in the past.
- We have a short-term swing high from the most recent wave, which was failing around the area of the previous high before that (marked on the chart with a ghost level). The current candle is failing as a Type 3 (borderline Type 2 with tolerance).
- The medium-term structure has given us an unconfirmed trend line, which the current candle is failing at as a Type 1 with tolerance.
Although the current candle is showing a slight increase in activity, it’s not the change in dynamics we’d expect to see if the price is going to break a dominant path of resistance, and multiple smaller paths of resistance. Recent activity has been very laboured, with a lot of two-way activity. This means we can increase the probability of a bearish outcome.
The short-term price structure is bullish, but it’s somewhat offset by the fact that the structure characteristics are clearly weakening. This means there’s only a marginal probability increase for the bullish outcome.
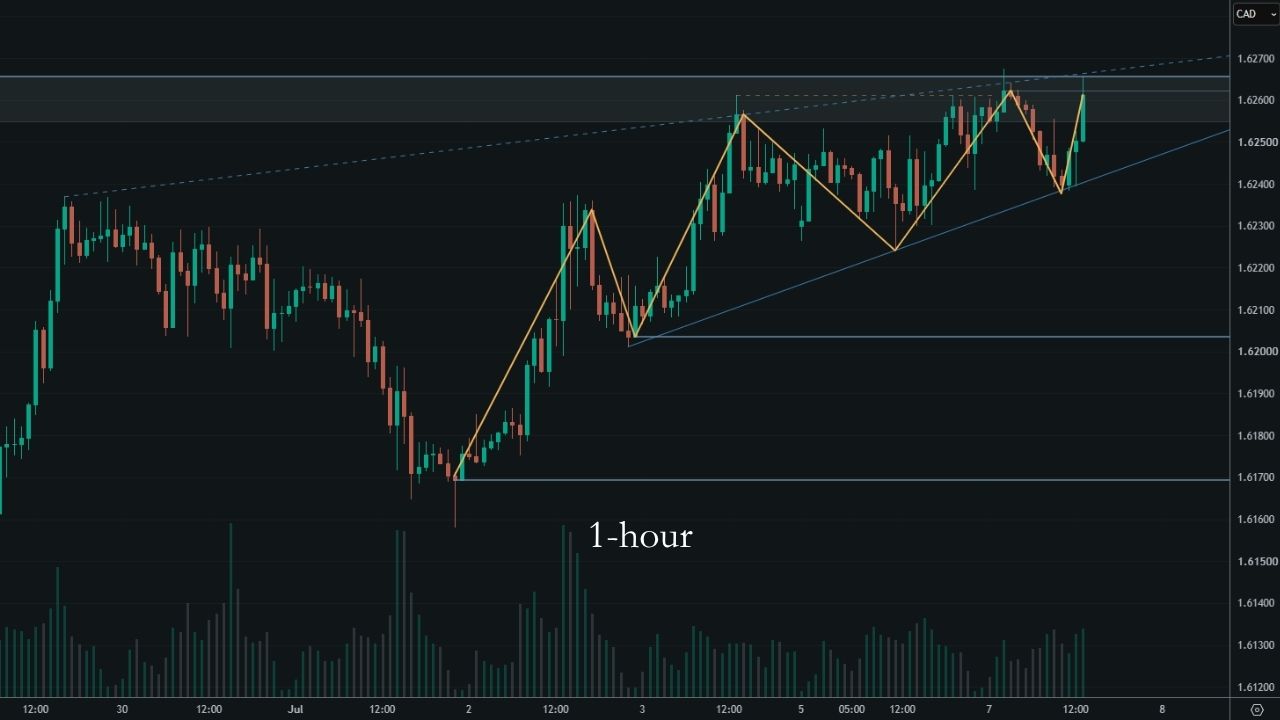
Overall, when we look at the first-order outcomes, we can very clearly see that we would be estimating the probability of a bearish outcome to be higher than the base rate. This gives us a positive expectancy opportunity.
But we can also consider what this would mean for the context. If the bearish scenario plays out, it means the bullish structure has potentially come to an end. That would be another shift in context, further reducing the chance of a bullish break of the dominant paths of resistance. So the negative adjustment to bullish outcomes would increase, making this an even higher positive expectancy bearish opportunity.
15-minute chart
As we’d had a short-term increase in bullish activity (although not enough to be concerned about), the 15-minute chart was used to time the entry. We have an initial swing high, but the recent interaction gives us multiple options for where that high might be anchored, which I’ve represented with a zone showing the possibilities.
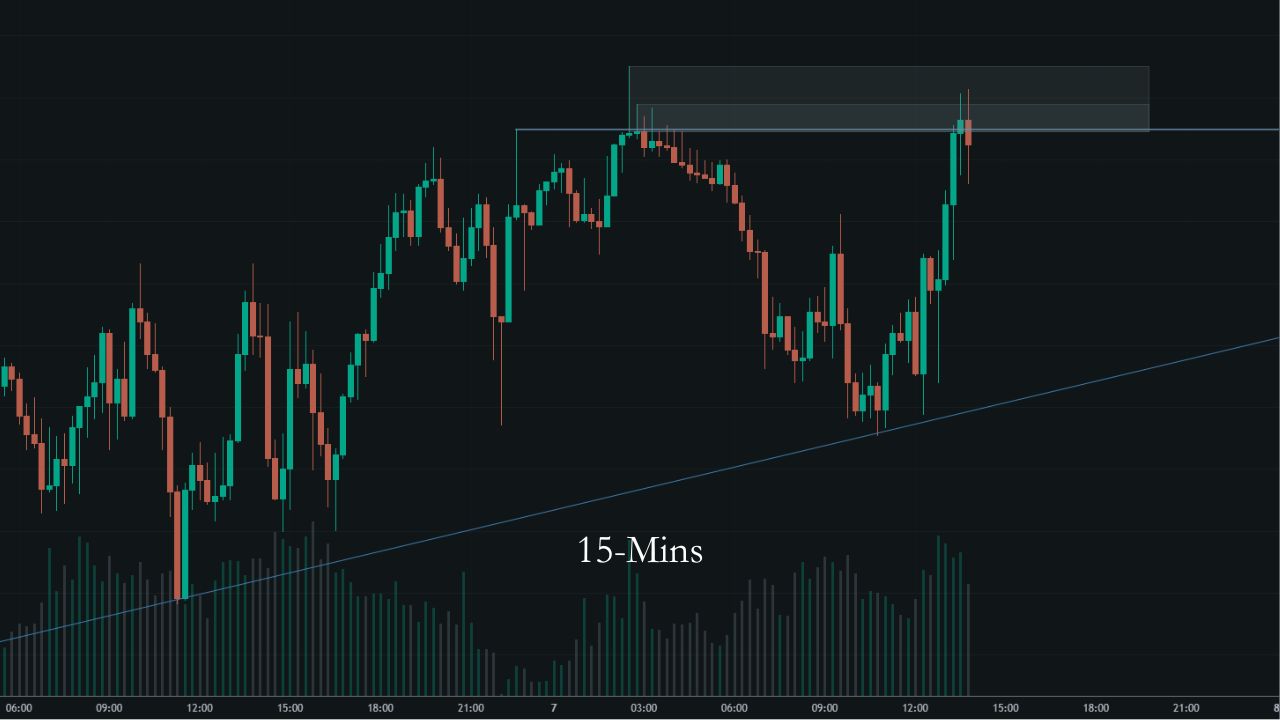
The price move ran out of momentum once it interacted with that area, but waiting for the close of the bearish candle meant there was less uncertainty about whether the momentum would continue.
Trade Entry
The working time frame was based on the 1-hour chart.
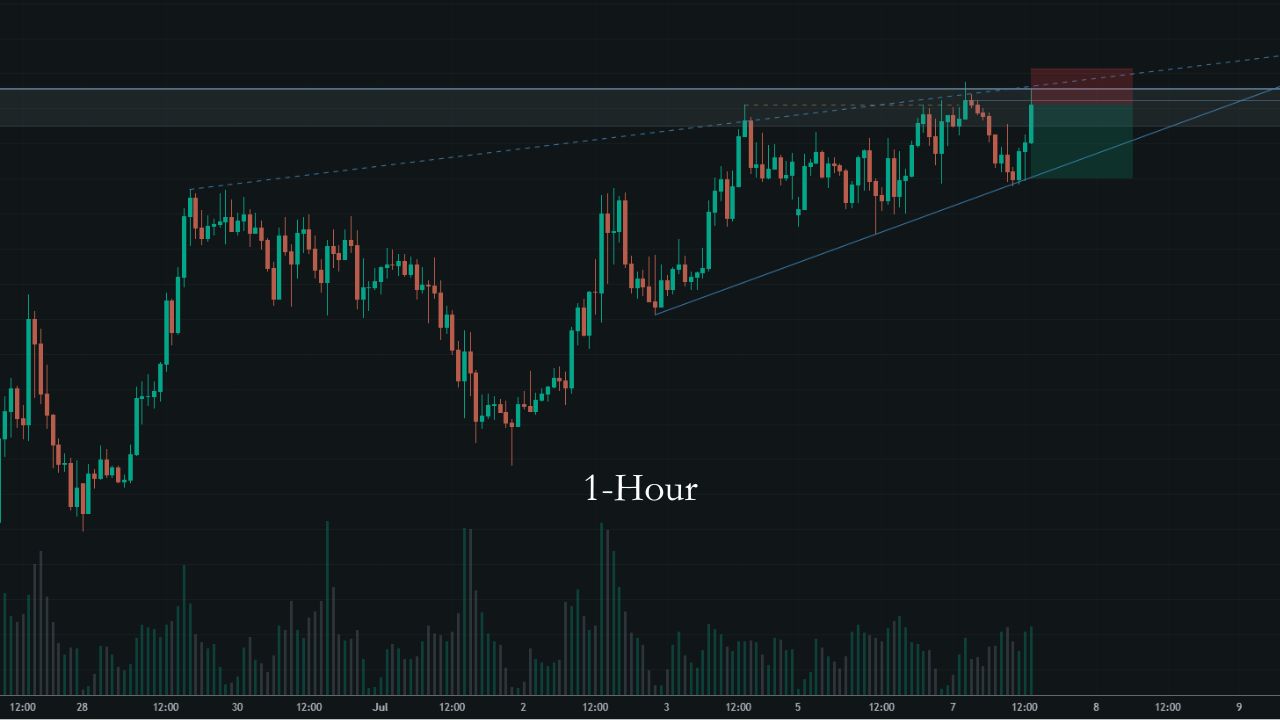
The stop loss was 10 pips above the entry, giving enough space for the price to test the paths of resistance and fail. But if price broke beyond that point with a strong imbalance, it would mean there was more activity behind the move than the setup implied, the opposite of what we’d expect if there wasn’t enough activity to overcome the shifts at those levels. So it would be right to exit there anyway.
The TMP (trade move potential), which is the first decision point, was at the previous low / confirmed short-term trend line. This was around 20 pips away.
| Bullish outcome | Bearish outcome | |
|---|---|---|
| Size | 10 pips | 20 pips |
| Base rate | 66% | 34% |
| Estimated probability | 59% | 41% |
EP/BR: 1.21
Percentage at risk (position size): 0.6%
Trade Management
The initial move cleared the first decision point (TMP) and closed through the path of resistance.
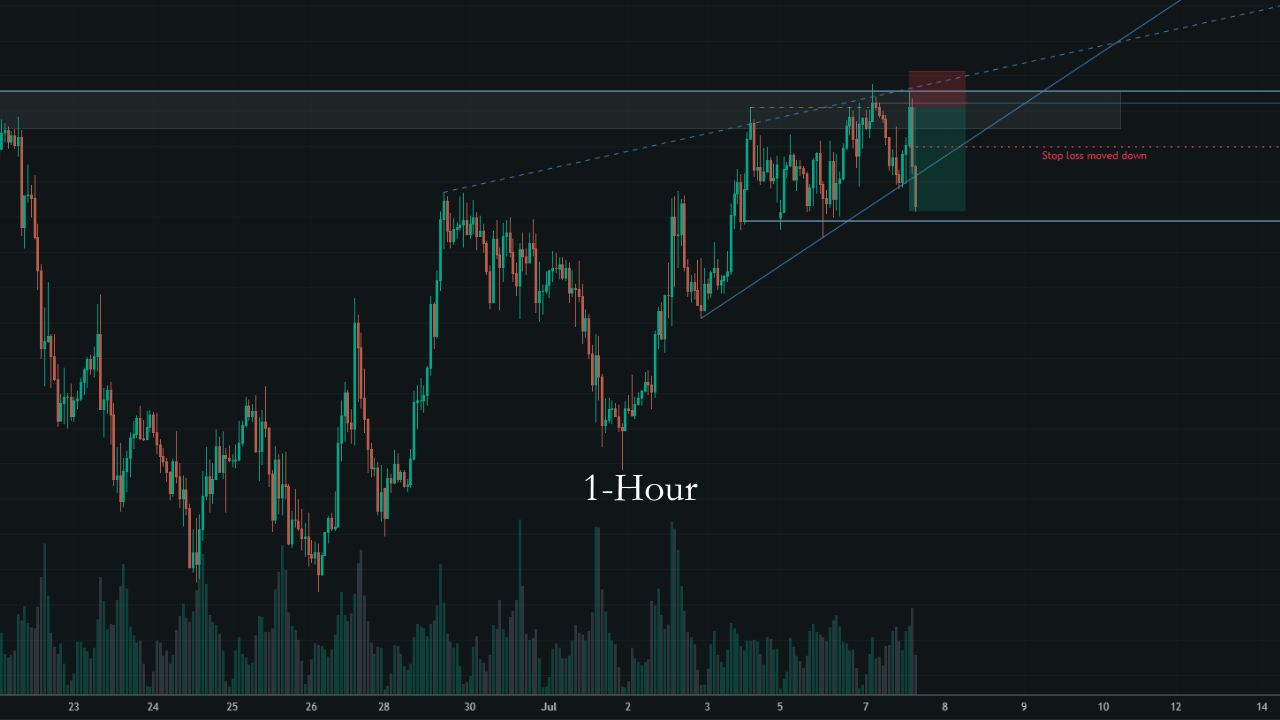
At this point, the expectancy for the higher order outcomes had increased. But there were two things to keep in mind:
- The daily paths of resistance below the price that we would now be approaching.
- If price managed to get back above the 1-hour trend line and short-term swing low, it would mean there was enough activity to overcome the strong bearish imbalance and the shift in activity at the paths of resistance. Since those paths of resistance would then be below the price supporting the bullish move, it would be giving us the signs that the chance of breaking the dominant paths of resistance is high enough for us to no longer have positive expectancy for the bearish move.
With that in mind, I moved the stop loss down. It gave enough space for the price to test and fail at the paths of resistance, but to be out of the trade if it cleared them. As the expectancy had increased, the percentage at risk at the stop loss was appropriate and no scale-out was needed.
The strategy remained the same for the next price moves, with the stop loss being adjusted to the next paths of resistance.
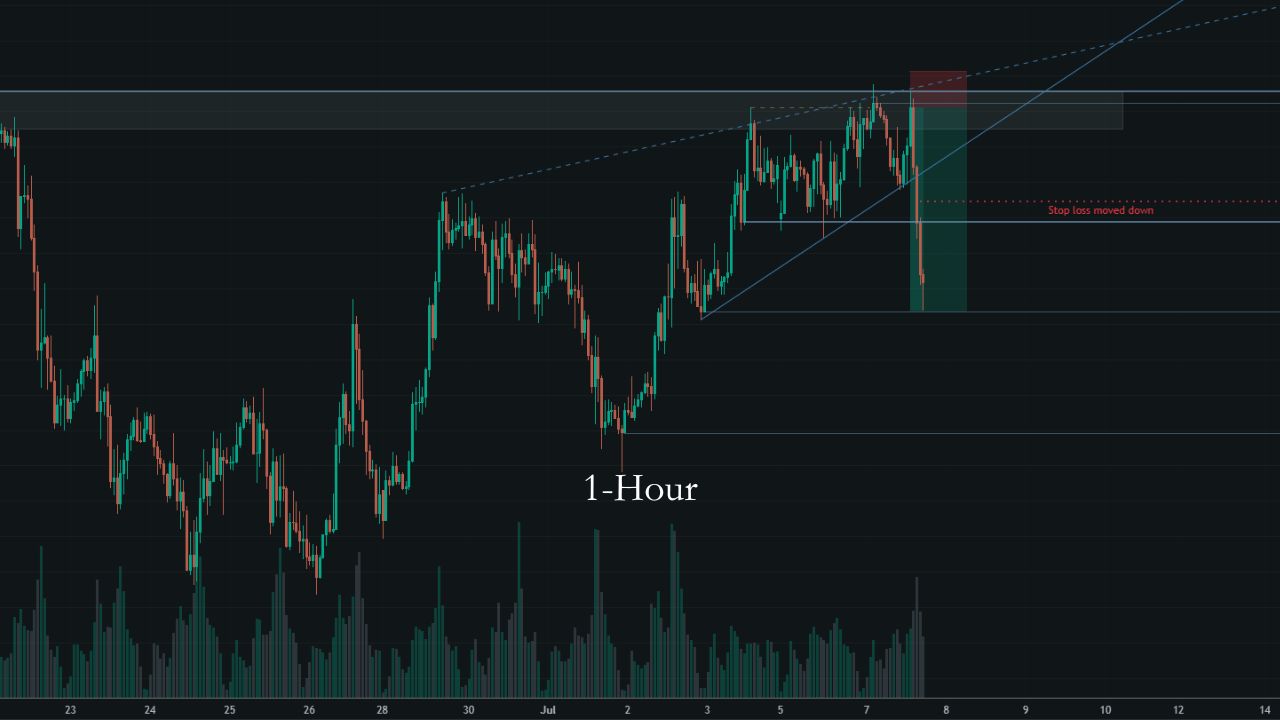
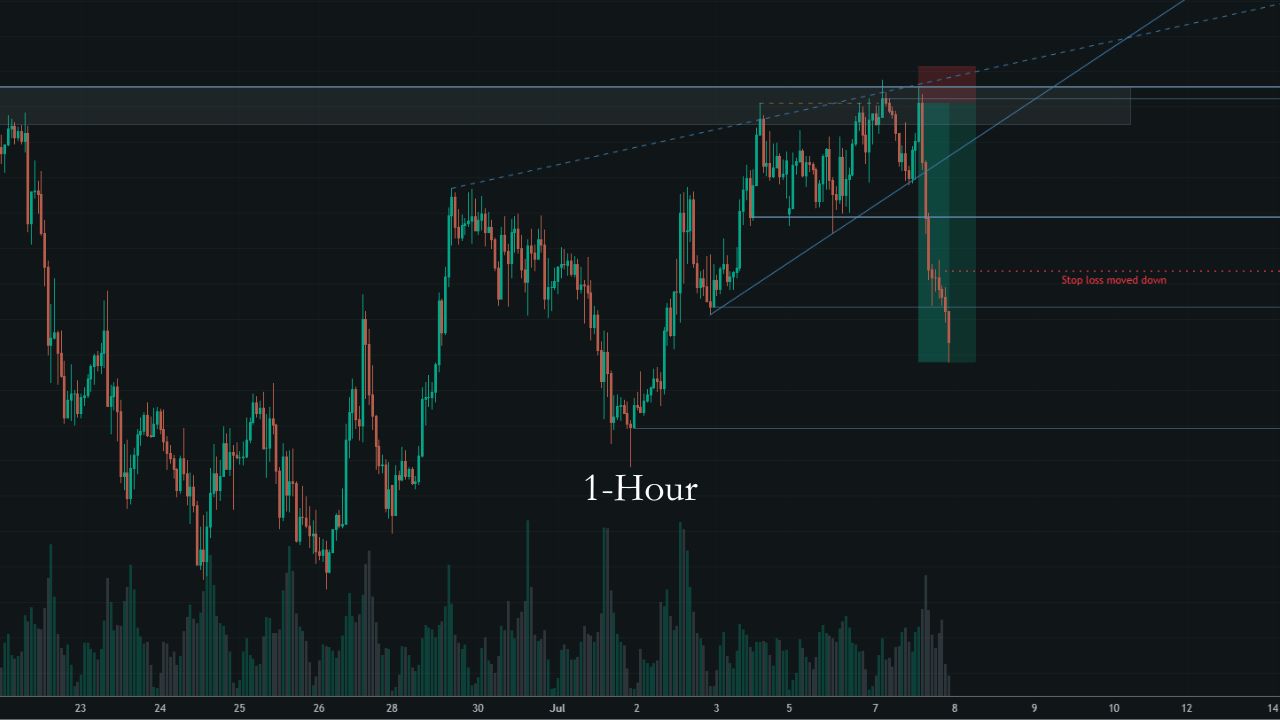
Overnight, we retested the path of resistance from below. Unfortunately, this wasn’t an opportunity for a scale-in for two reasons: 1) we had passed through the daily trend line, but could still be attracted back to fail at that level for the daily close, 2) we were around the daily zone, which we already determined earlier could still be strong.
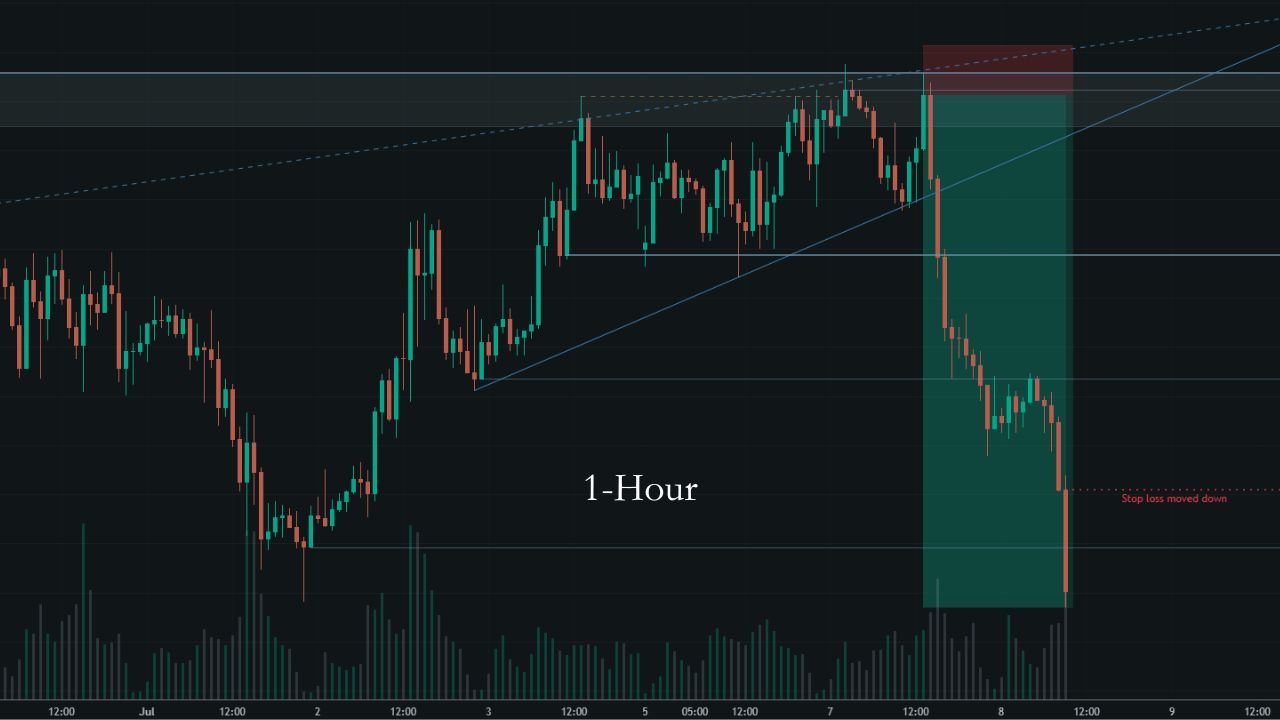
Eventually the price reversed enough to trigger the stop loss. At this point, on the daily time frame it was looking like we may end up closing as a double confirmation, failing at the zone and the trend line.
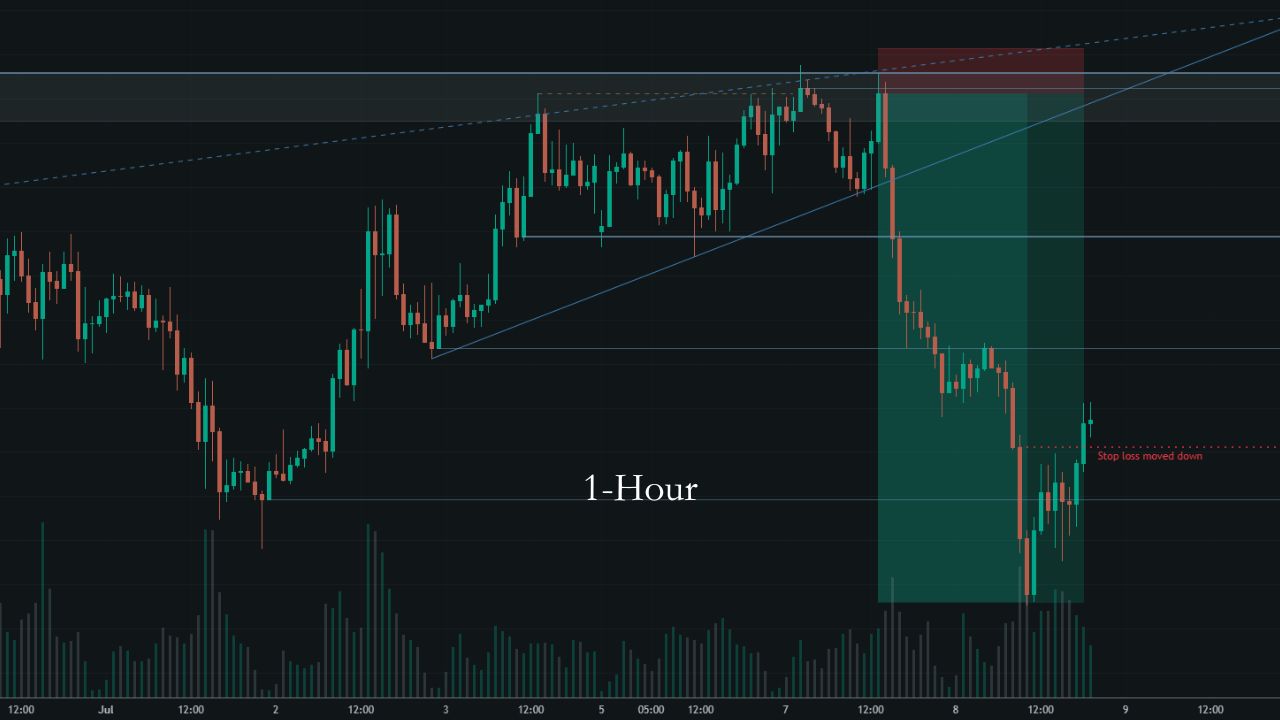
The total profit was around 5% from an initial risk of 0.6%.
Free Training Series
Start the free training.
Get free access to our 5-part training series. It covers the foundations of the Duomo approach, how to analyse markets logically, and the skills serious traders need to develop.