

There’s a way of looking at probability adjustments that changes how you approach an opportunity, and it’s particularly useful when you don’t have much conviction about what happens next.
The way we judge an opportunity is by assessing whether there’s positive expectancy. That involves estimating the probabilities of the potential outcomes. (If you haven’t learnt about this yet, check out our free training series.)
One way to do that is by starting with the base rate probability and then making adjustments based on what your analysis is showing.
What I’ve seen with our members is that most of these tend to be positive adjustments. By that I mean, increasing the probability of a particular outcome due to something that’s in favour of it happening.
In general, the biggest of these types of adjustment will come from interactions with significant levels.
For example, in the diagram below, price can either carry on through the level (Outcome A) or fail there and reverse (Outcome B). You’d increase the probability of Outcome B because you expect a shift in activity at that level, meaning participation changes there and the move struggles to continue.
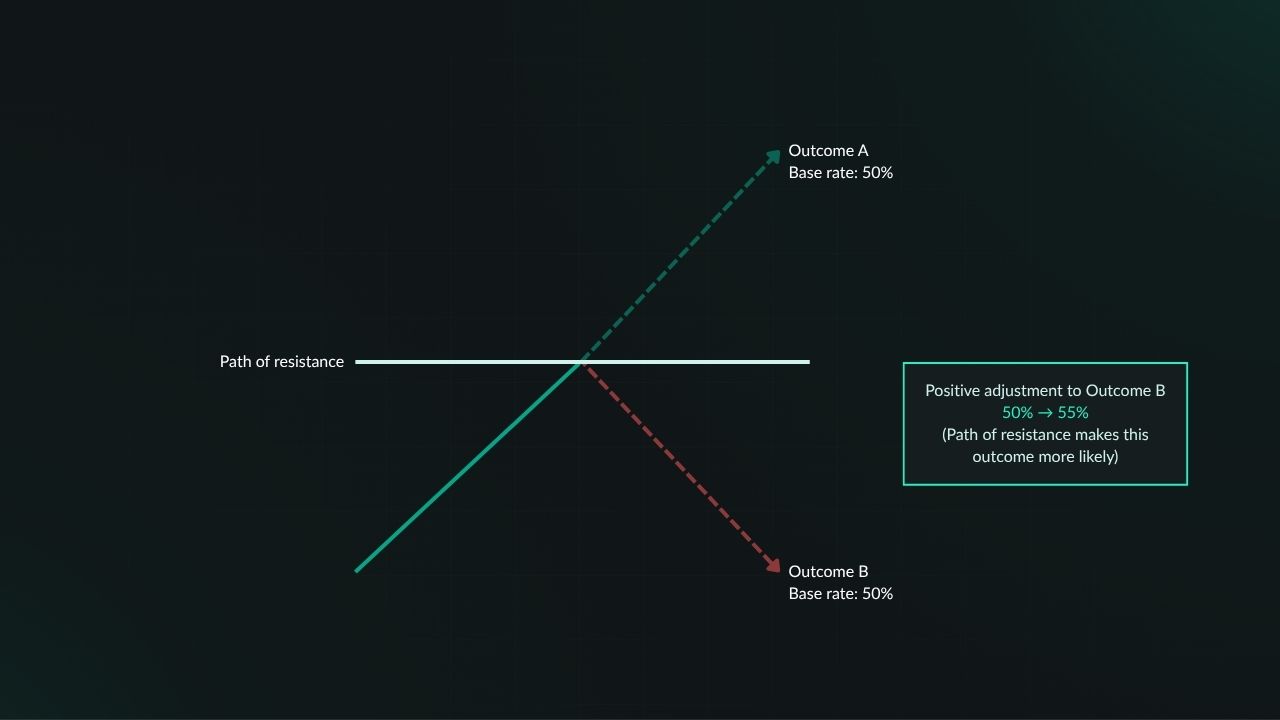
That’s what I mean by a positive adjustment.
But we also have negative adjustments. In those cases, we’re decreasing the probability of the same outcome based on contextual factors that work against that expected shift in activity.
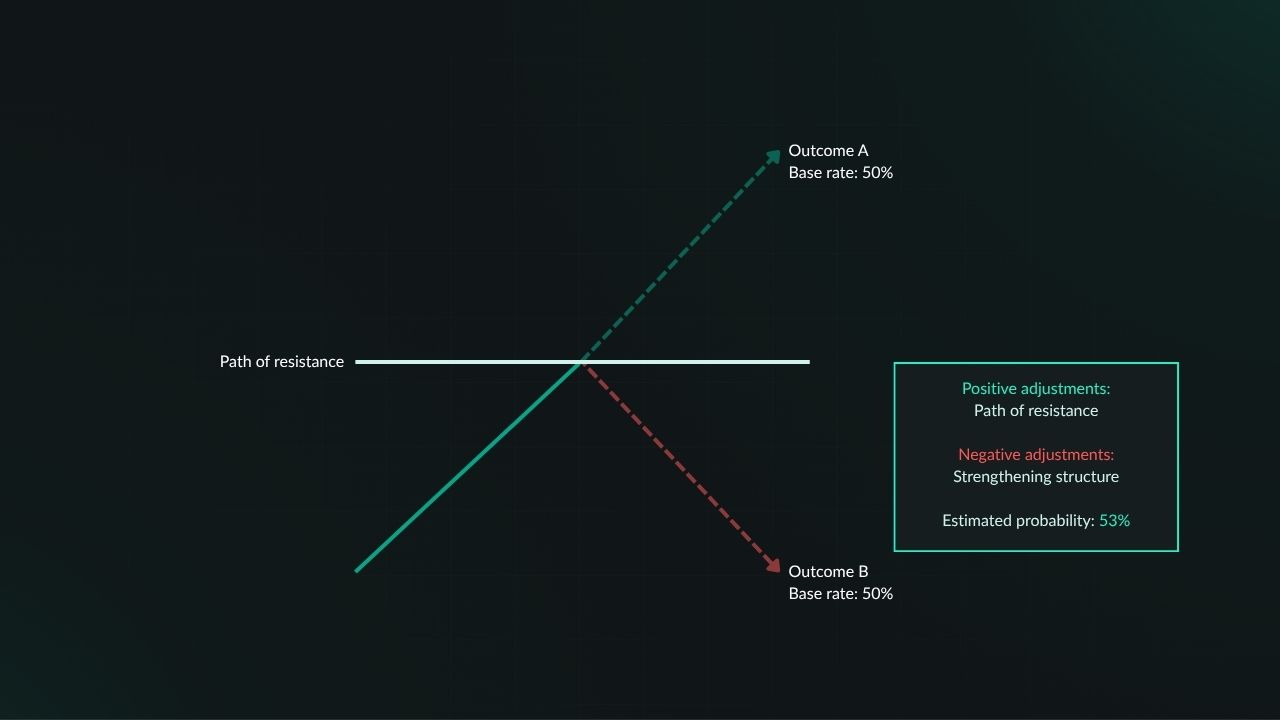
But let’s think about the significant level more carefully.
One of the principles of the Duomo Method is that we trade against weakness rather than trading in favour of strength.
To give you a basic example, if we see price failing at a significant level, it’s showing weakness in the move towards it. In other words, it’s less likely to be able to overcome that shift in activity, and that weakness means the opposite outcome has increased in probability.
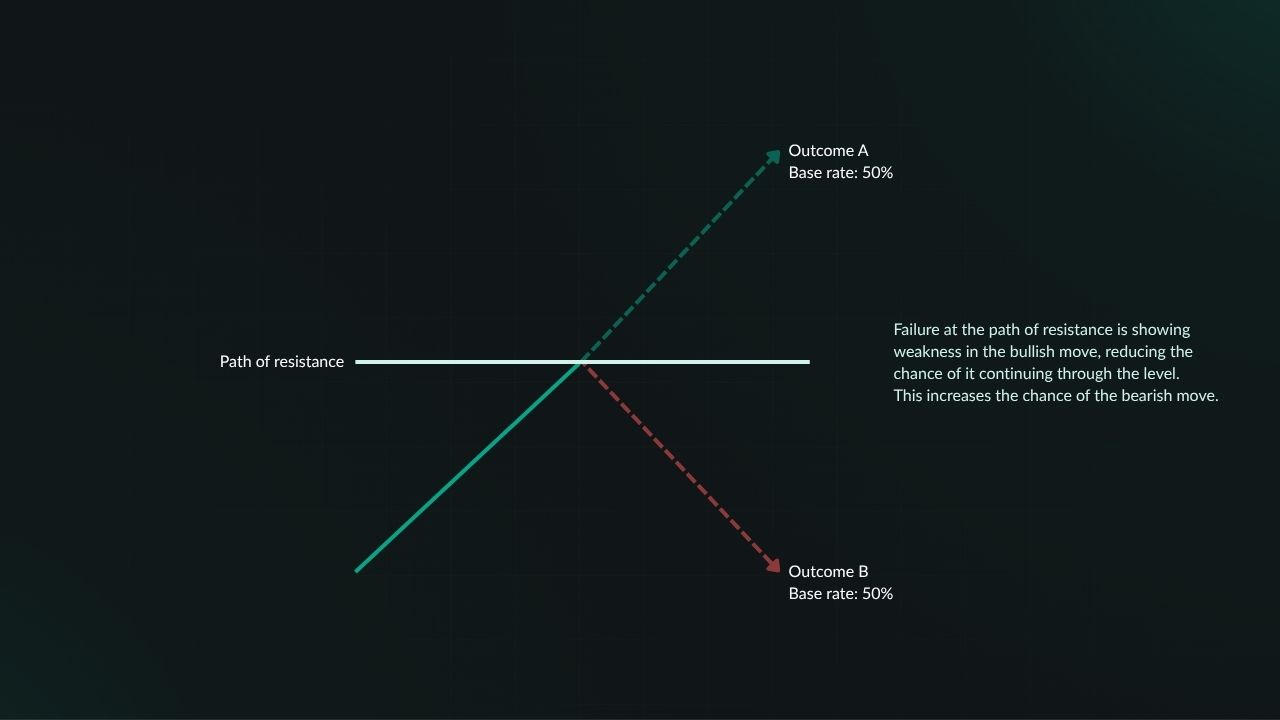
When you think about it, that isn’t a positive probability adjustment at all.
In reality, we’re making a negative adjustment to Outcome A. And since the price can only do one of two things here (Outcome A or Outcome B), any negative adjustment to one side means a positive adjustment to the opposite side.
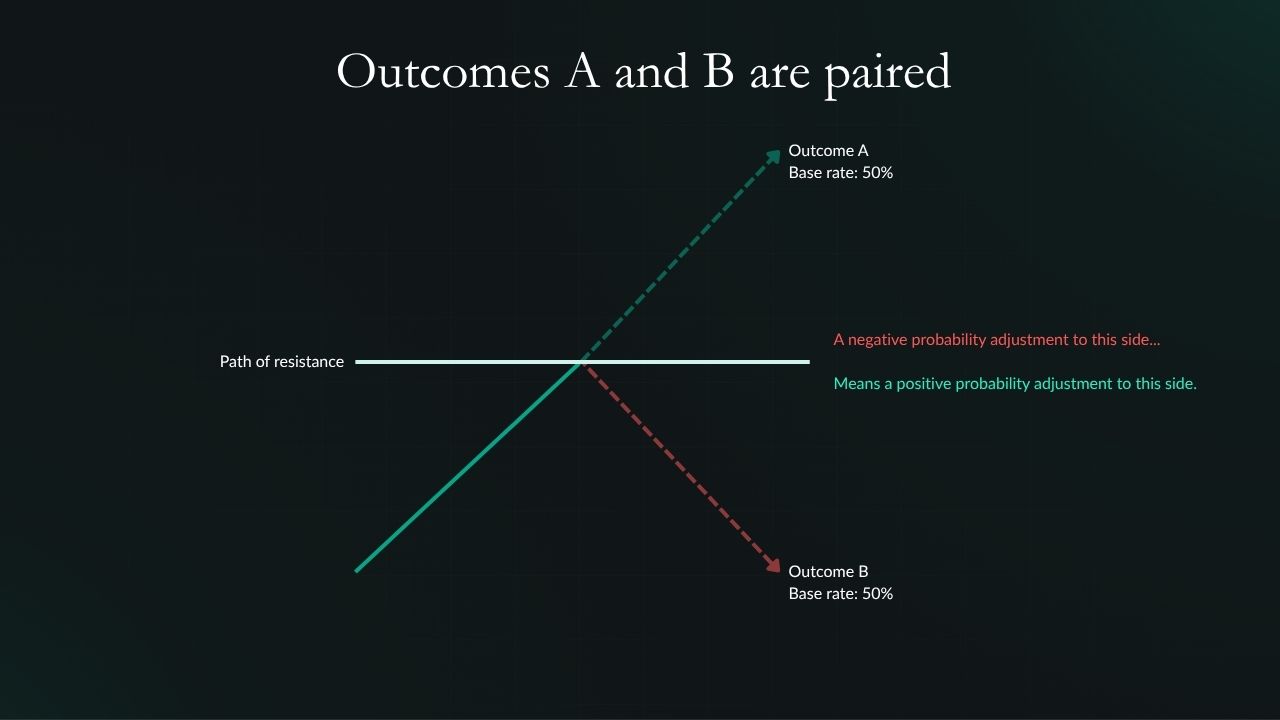
With this in mind, most of our probability adjustments are actually negative ones rather than positive ones.
This might just sound like semantics, but when you understand this, it allows you to estimate probabilities in situations where you don’t have as much conviction in what may happen next. Rather than looking for the positive probability adjustments, you can focus on where there are potential negative adjustments.
In fact, this helped me just last week with a trade on AUD/CAD.
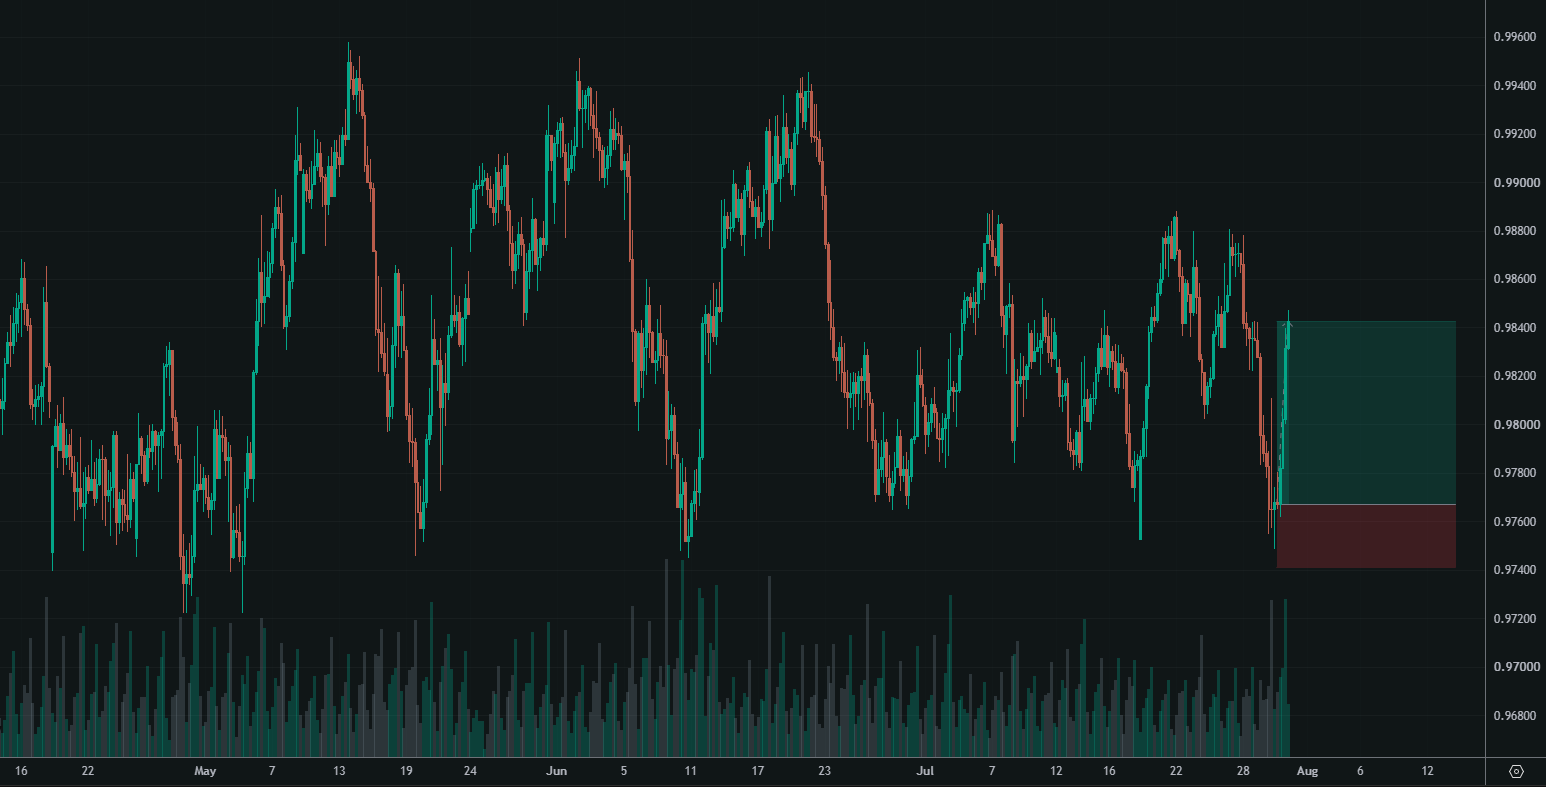
There was a clear negative probability adjustment for moves through the bottom of the range even before price returned down there. That was the basis for a positive expectancy opportunity, and I just had to time my entry at a point where there wasn’t a significant adjustment the other way. In the end, I only needed a single confirmation to enter, and that was enough for the context.
I’ll be posting a full breakdown of that trade soon, but in the meantime you can also go through a similar trade I took on NZD/CAD last month.
So when nothing looks obvious, stop asking what price is likely to do. Ask what it’s going to struggle to do.
Free Training Series
Start the free training.
Get free access to our 5-part training series. It covers the foundations of the Duomo approach, how to analyse markets logically, and the skills serious traders need to develop.