
If you aren’t a member of the Duomo Trader Development Program, you may not be able to follow everything clearly. But if you’d like to learn how to analyse markets in this way, interpreting context, finding valid opportunities, and planning appropriate strategies, you can find out more about DTDP here.
Market Selection
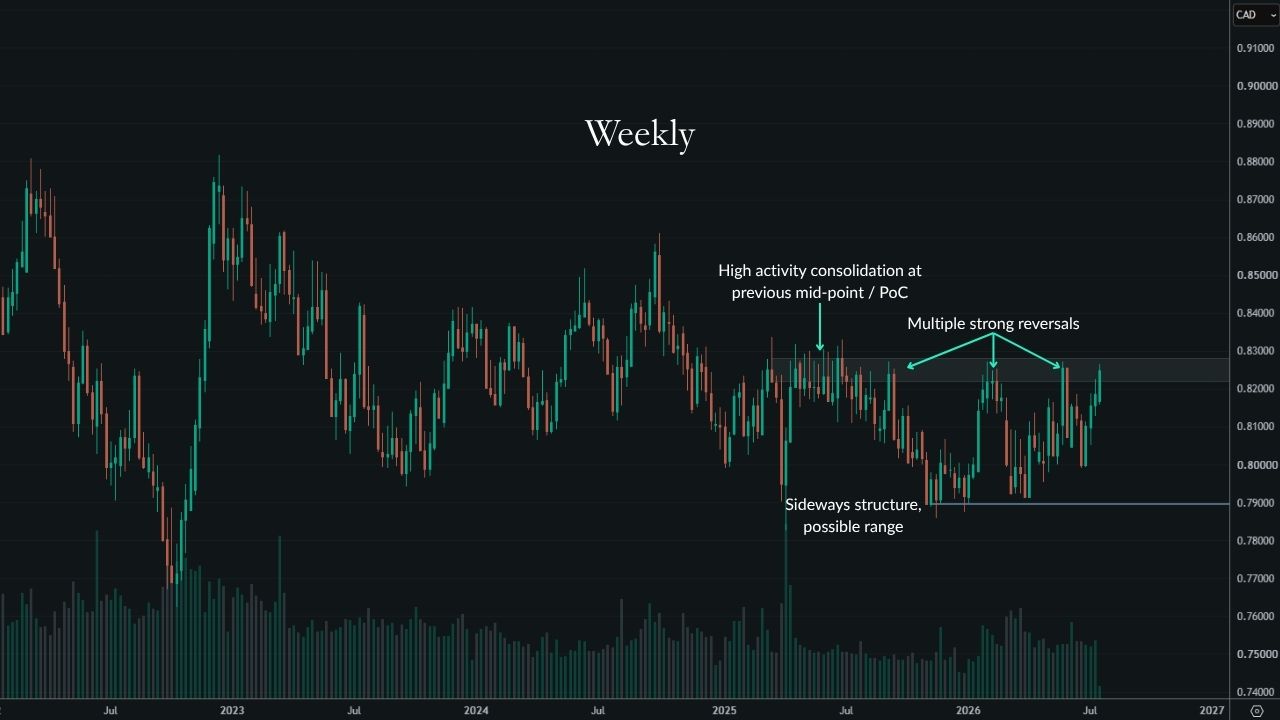
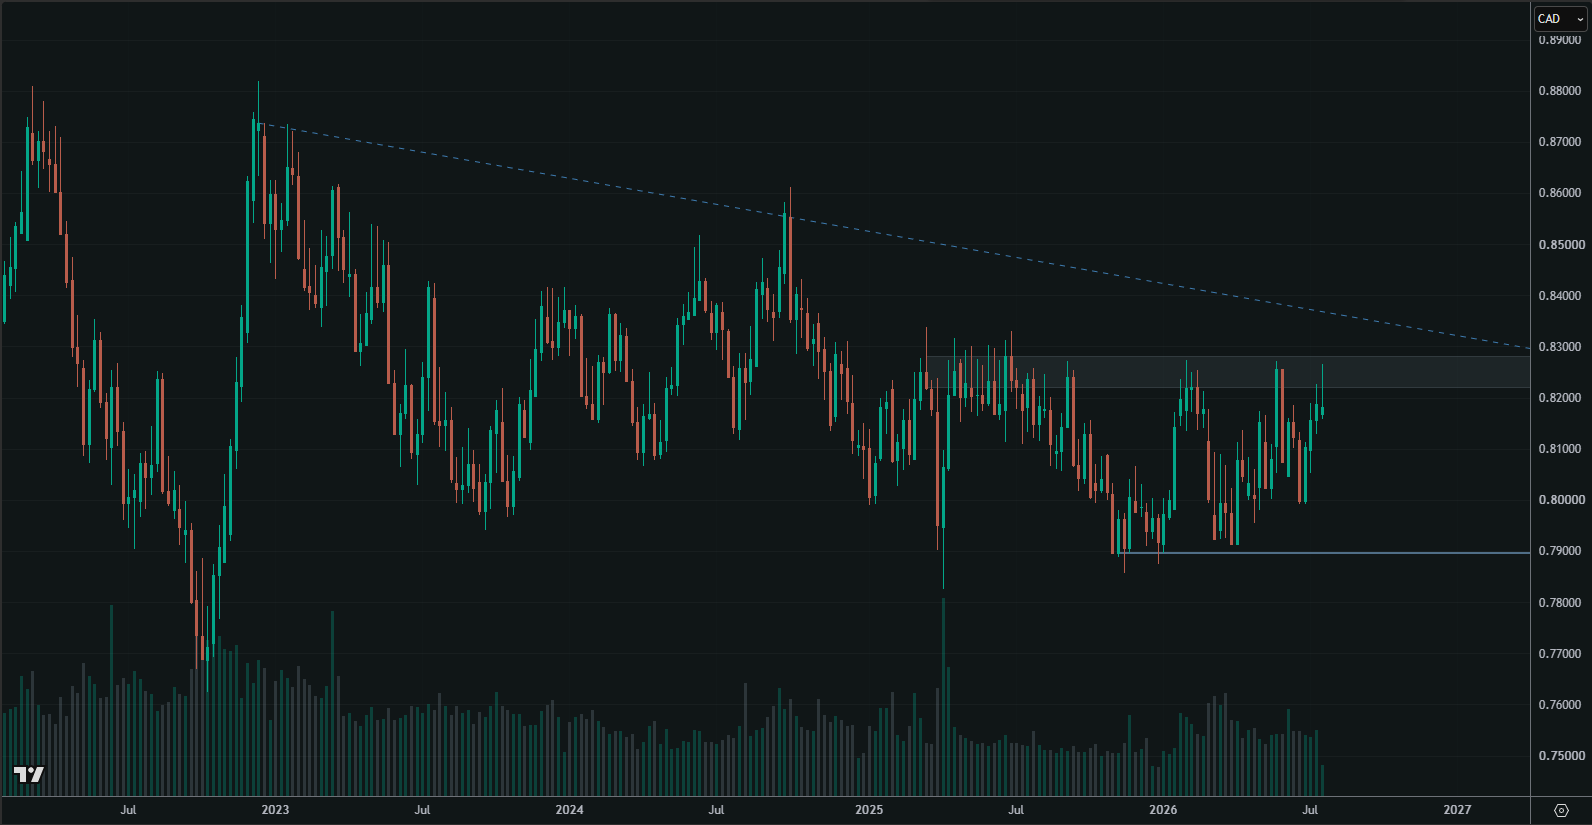
This is a market that’s frequently been on my market selection list for a long time. The long-term structure has been sideways with clear upper and lower sides of a potential range. In particular, the upper side of the range is well-defined.
Initially we had high activity consolidation around the mid-point/PoC of the previous sideways structure/slow moving trend. This became the top of the new range, and we’ve had multiple strong reversals since then.
When we look closer on the daily time frame, we can see the huge amount of transactions that happened around the top of the range, and how much effort there was behind attempts to break higher, which ultimately failed.
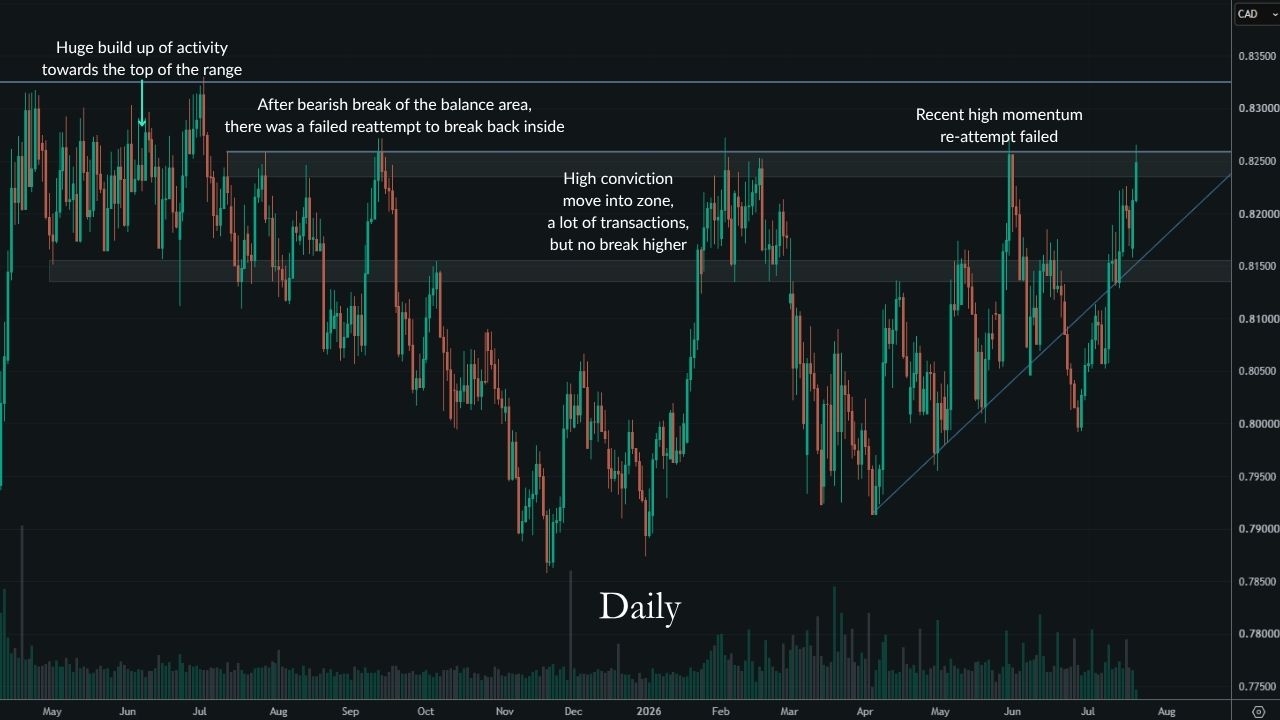
The conclusion is that a huge amount of bullish activity would be needed to break higher, so we can already apply a negative probability adjustment to any moves through the top.
With that in mind, any bullish moves that get close to the top of the range are likely to have a positive expectancy forecast already from the long-term time horizon context.
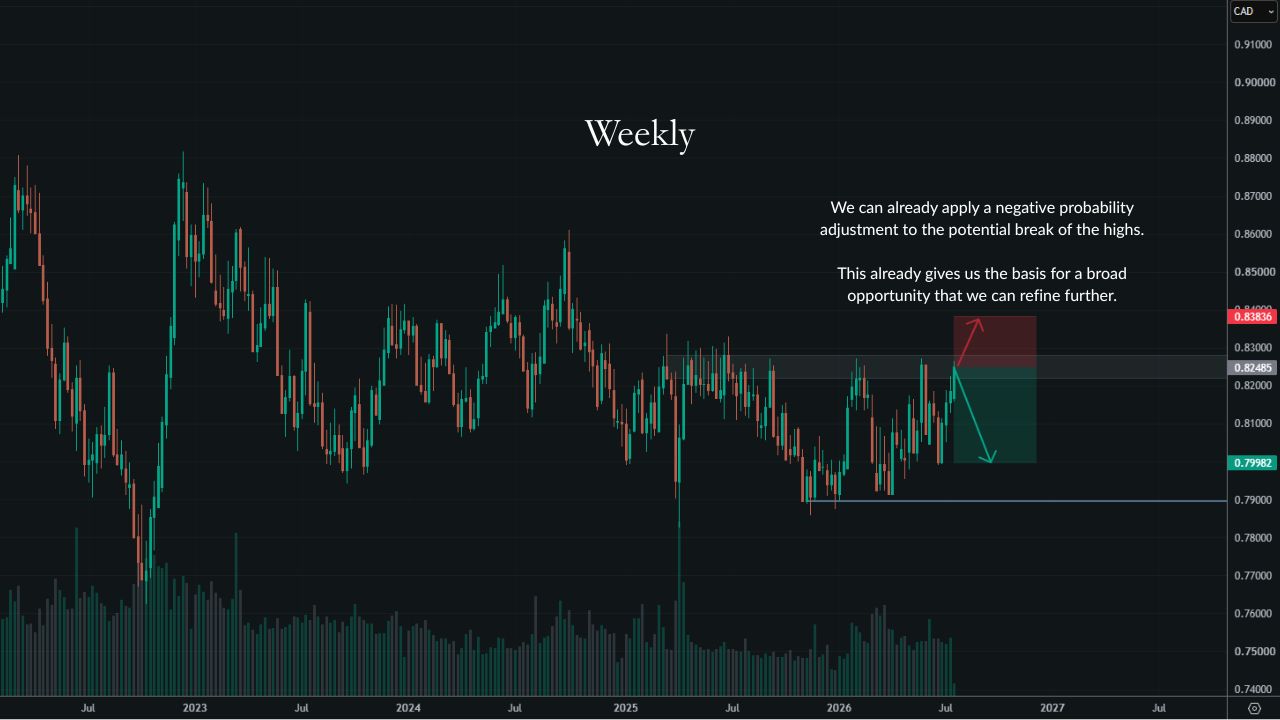
Therefore, we already had the basis of a broad opportunity on the higher time frames.
We can then look to refine this by focusing on shorter-term time horizons to see whether it’s possible to improve the expectancy. This would be as a result of:
- Tightening the negative potential outcome
- Improving our probability estimate accuracy
- Finding situations where the probabilities have improved
Analysis
Let’s start by taking a closer look at the daily time frame.
The market had been forming bullish structure leading up to the last reattempt to break the upper zone. The final leg of the wave showed strengthening structure characteristics, and the Triad of Price Action was indicating solid momentum. Yet it didn’t break higher.
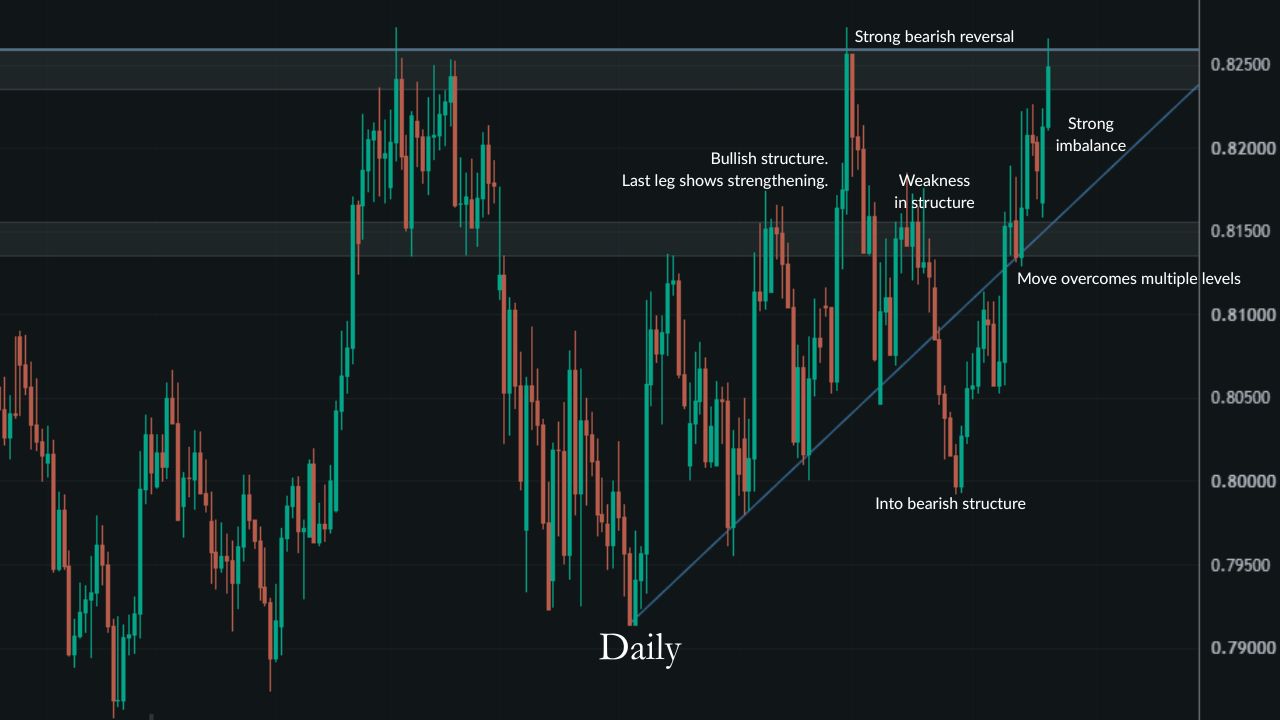
It was a strong reversal from the upper zone, which is evidenced by 3 important points:
- The imbalance it needed to overcome to reverse the bullish move
- The fact it overcame the zone below without much of a reaction
- The level of imbalance we see in the bearish move
Initially, it wasn’t able to break the trend line related to that bullish structure, but the next high failed to break the lower zone, showing a reduction in conviction. This created a lower high, which was weakness in the structure. We then had two further signs of a trend change, with the trend line being broken and a full switch to a bearish trend after the previous low was broken.
With this in mind, the most recent bullish move clearly has strong participation. Here are the signs:
- It reversed the new bearish structure in just one leg
- It overcame two paths of resistance (the zone and the trend line) that had previously led to changes in structure
- When interacting with the paths of resistance, there were only relatively minor fluctuations rather than full reversals
These factors mean there needs to be a positive adjustment to the probability of a bullish continuation. The question is whether that adjustment is enough to completely offset the negative adjustment we already made for any moves breaking the top of the range.
The key question I ask myself is whether this time is different from the previous attempts. That means reviewing the significant levels and the activity behind the move itself.
In terms of the significant level, we have no reason to believe it’s any weaker. In fact, there’s an argument to be made for it becoming stronger and a more important reference point in the market.
In terms of the activity behind the move, although it’s strong, it’s not as high conviction as the last attempt to break higher. It’s also likely that overcoming multiple paths of resistance, and beginning the move from a much lower price point, means there won’t be as much participation now and it might not take as much absorption to exhaust the move.
With these points considered, the conclusion is that we still have positive expectancy for a bearish reversal rather than breaking through the top of the range.
So we can already refine the opportunity from what we originally had from the weekly time frame.
The bearish potential outcome can be adjusted to the paths of resistance below. If price reverses from those, it could mean bullish structure is continuing and context is changing. Therefore, failure at those paths of resistance would need to be a decision point where we reassess the context to determine whether bullish participation is still strong, and/or whether the zone above is losing strength.
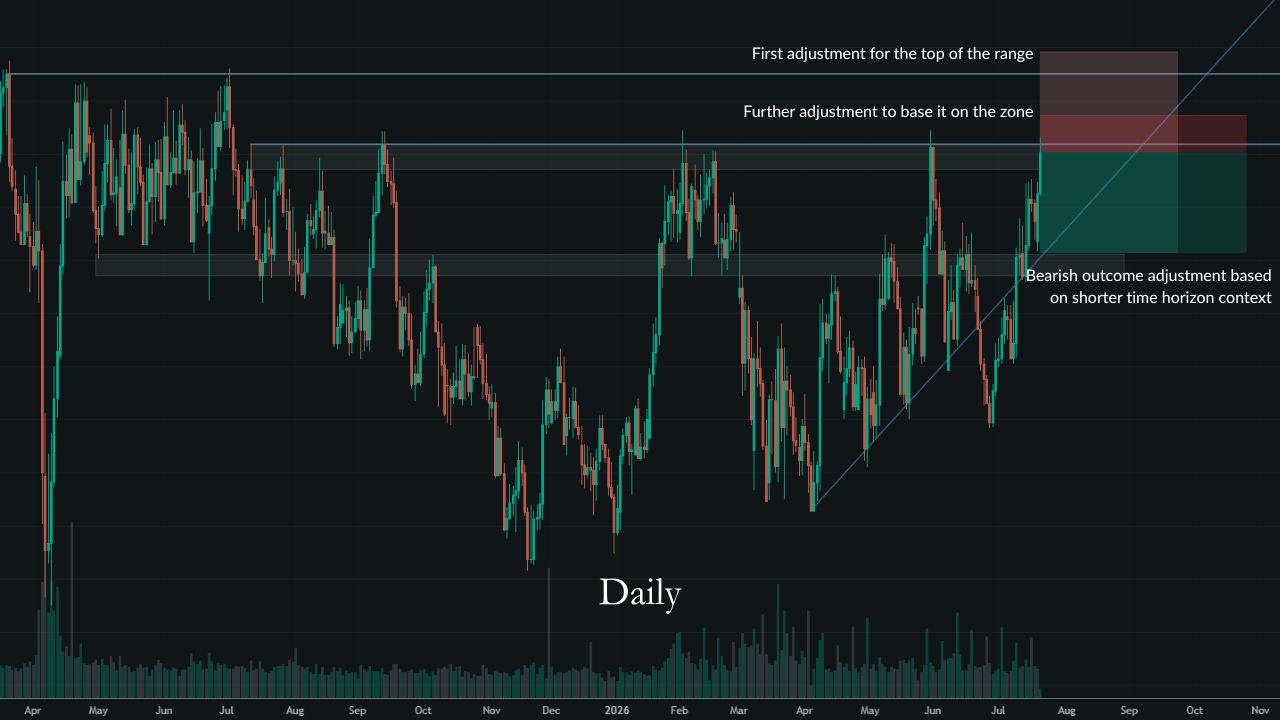
The stop loss can firstly be refined by bringing it closer to the top of the overall range. We would only need to allow for reasonable failure at that level.
However, at this point the zone carries a lot of significance to the overall context. If we break the zone, 1) we would need to reassess the context, and 2) we may be looking at a different holding period due to price potentially consolidating in that area.
Therefore, we can tighten the stop loss to be based on the zone, allowing space for a Type 2 or 3 failure there. If the stop is triggered and, after reassessing, it seems there’s still an opportunity, there can always be a re-entry.
Trade Entry
Now let’s look at the shorter-term time horizons to refine this further and find an ideal entry point for this opportunity, where the expectancy is closer to being optimal.
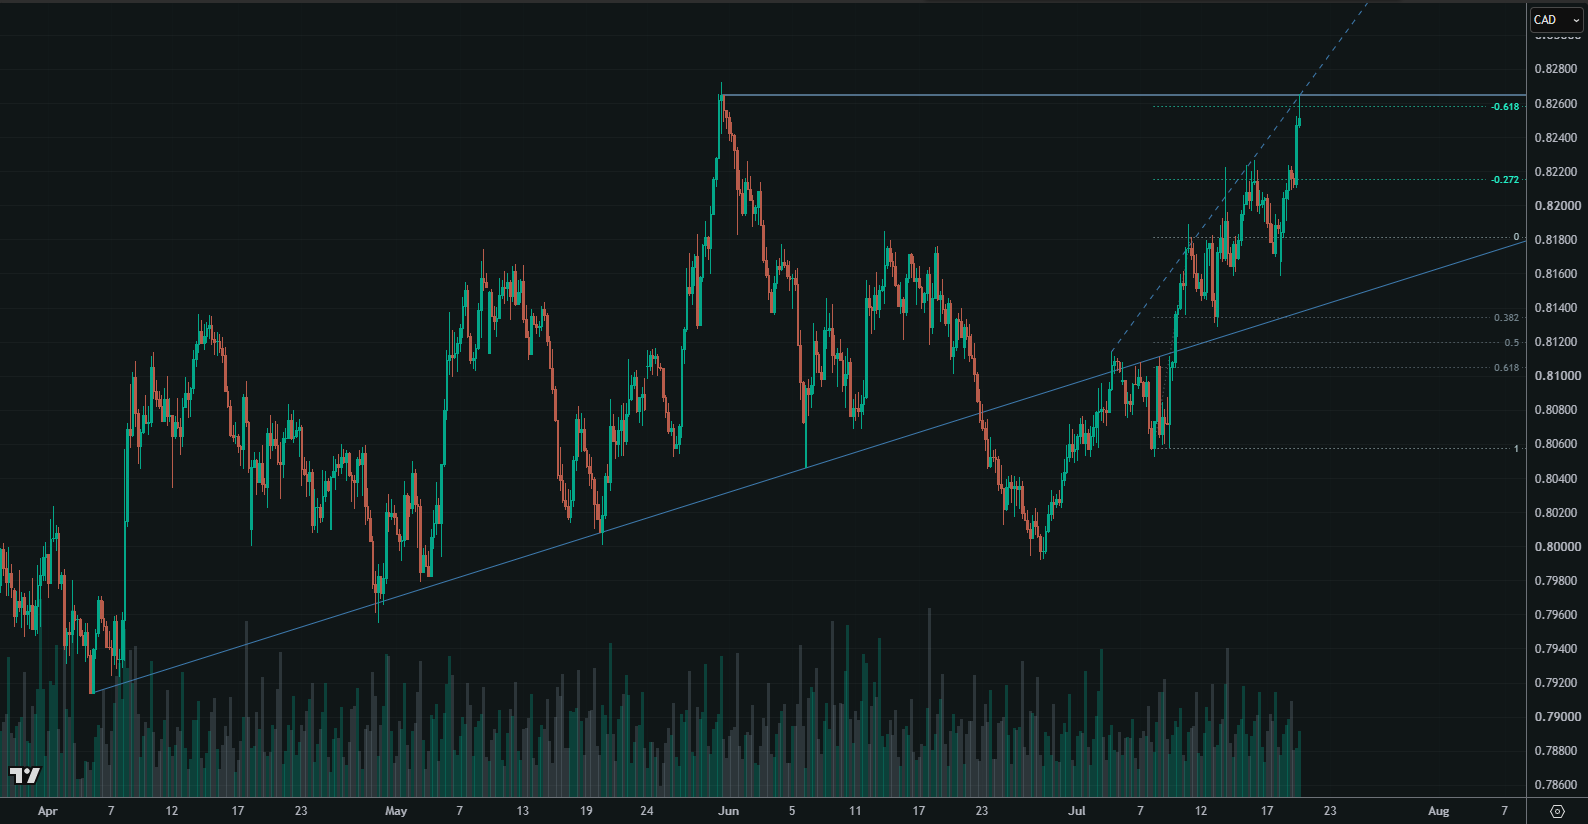
On the 4-hour chart, there are some important new contextual elements that add to our analysis.
The recent bullish leg from the daily time frame is now shown as a structured trend. That means we can assess the structure characteristics and make a judgement about the activity supporting this move.
Although the structure characteristics are somewhat strengthening in the recent leg, the overall trend doesn’t look as high conviction as the previous high.
However, the structure may actually mean that it’s well supported, so we can refine our first decision point for the opportunity to be based on the shorter-term structure. That way we can make the right assessment as the opportunity is playing out.
We can also see several new paths of resistance.
We have the previous failure, which gives us a very strong swing high (a major one relative to this time horizon) and is a visible significant level. We’re failing as a perfect Type 1 close.
Then, for the current bullish trend, as we’re breaking to a new high we need to rely on invisible significant levels. We have two of them from the bullish structure:
- A trend line mapping the highs of the structure, which is unconfirmed but high dependability. Again, we’re failing as a perfect Type 1 close.
- A confirmed Fibonacci range, which already led to a reversal at the 127.2 and now we have a Type 3 failure at the 161.8.
The 4-hour time frame will be the working time frame for this trade. We can now refine the opportunity further:
- We can adjust our potential outcomes to reflect this time horizon.
- The stop loss can be tightened to allow for failure at the paths of resistance above, while ensuring we exit if they’re broken.
- The TMP will be the previous high, but realistically the second-order outcome to the B-point of the Fibonacci range needs to be considered for the expectancy calculation.
- The adjustment that was made for the strength of the bullish move on the daily chart can be reduced, since the move appears lower conviction on this time horizon, and our bullish potential outcome already accounts for the fact that the move might be supported.
- We can increase the probability of a bearish reversal due to the additional paths of resistance.
So, point 1 changes the potential outcomes, points 2 and 3 both increase the probability of a bearish reversal.
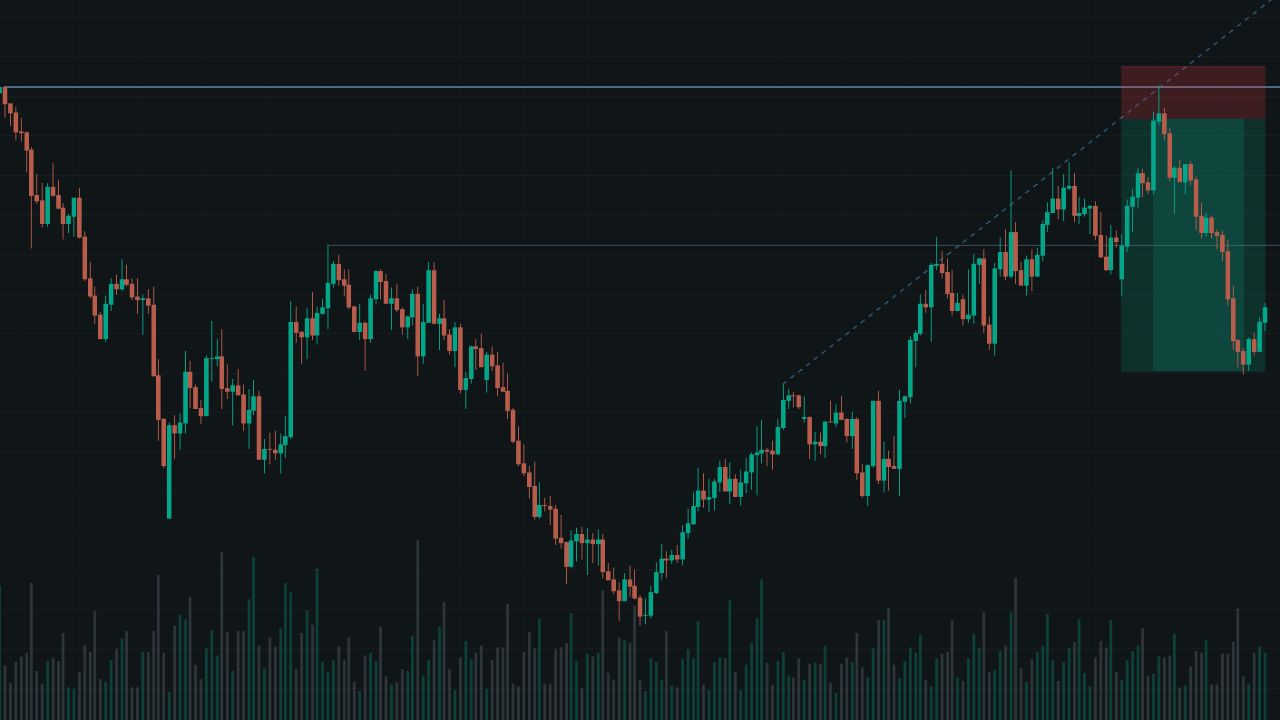
Although the entry is based on the 4-hour close, I came to the charts about 45 minutes later, so we’d already had a marginal bearish move. Here’s the initial trade:
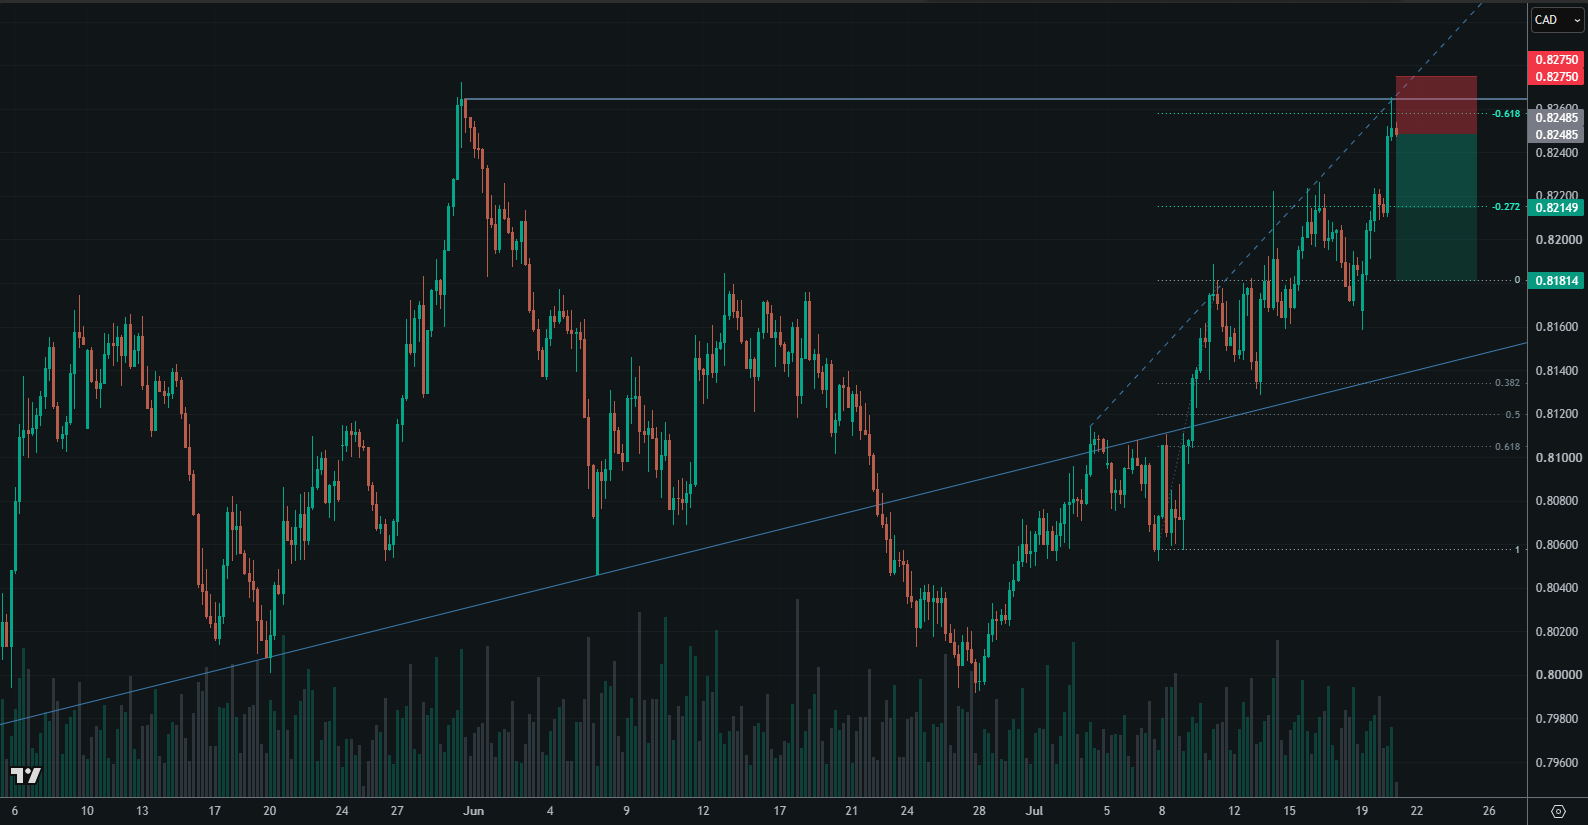
This is based on the first TMP, but the higher-order outcomes heavily contribute to the position:
Base rate: 39%
Estimated probability: 47%
EP/BR: 1.21
Percentage at risk: 0.9%
Trade Management
First Decision Point
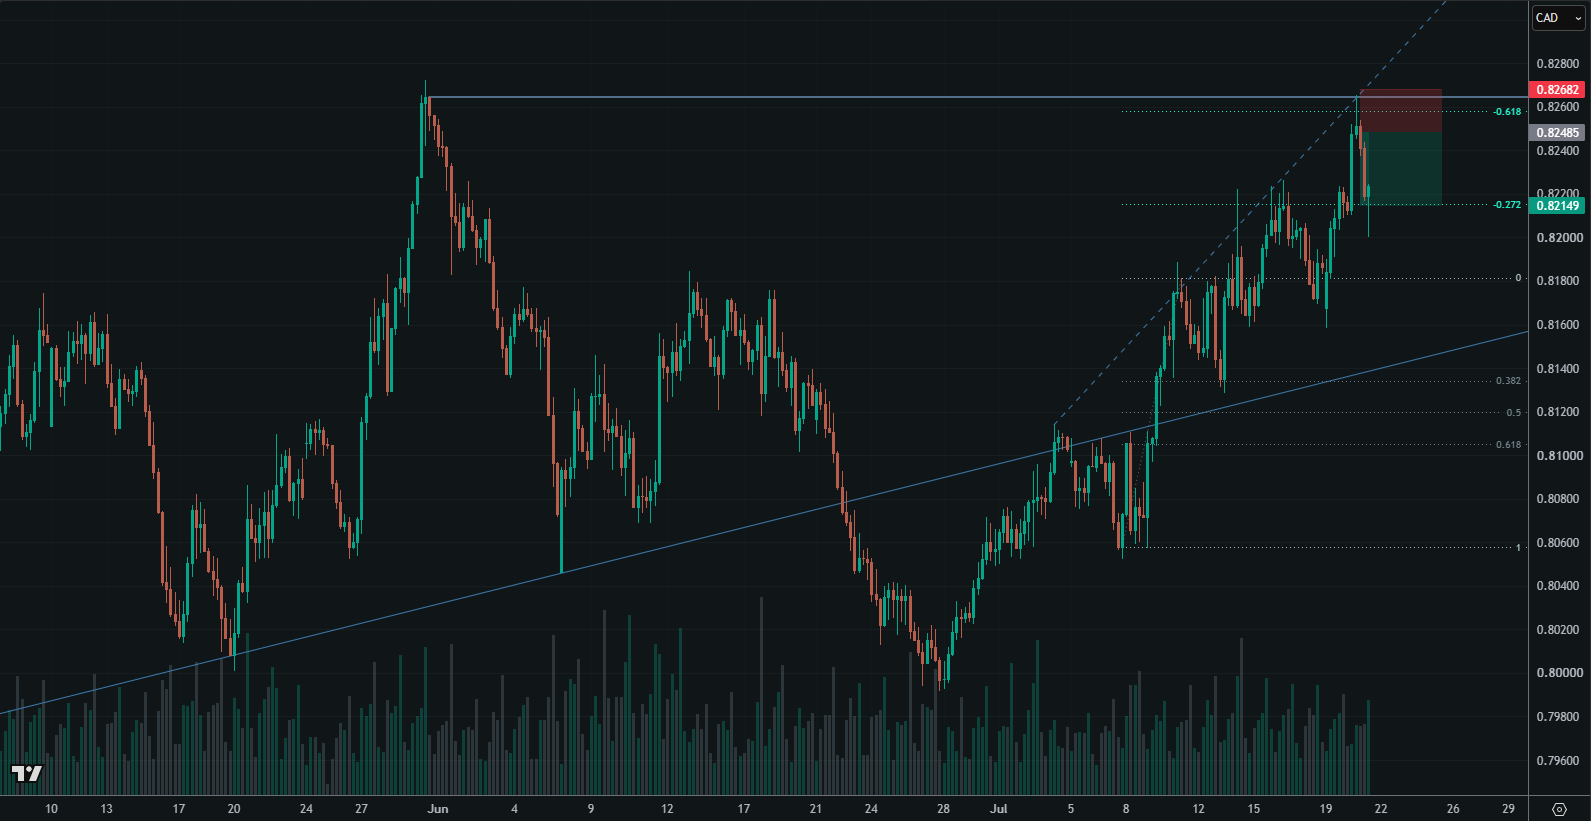
The strong reversal confirms the significant levels are still creating a big shift in activity. It’s not a surprise that price has struggled to break the previous high initially, as this was a level where there were multiple failed attempts to break during the previous moves up.
The reversal from the top has now created a new minor swing high for the short-term time horizon. With that in mind, I can tighten the stop loss based on that. A move back into that area would show strong bullish participation, so that would be a chance to reassess.
The expectancy of the opportunity has marginally improved, but it’s not the right time to start looking for a scale-in.
Second Decision Point
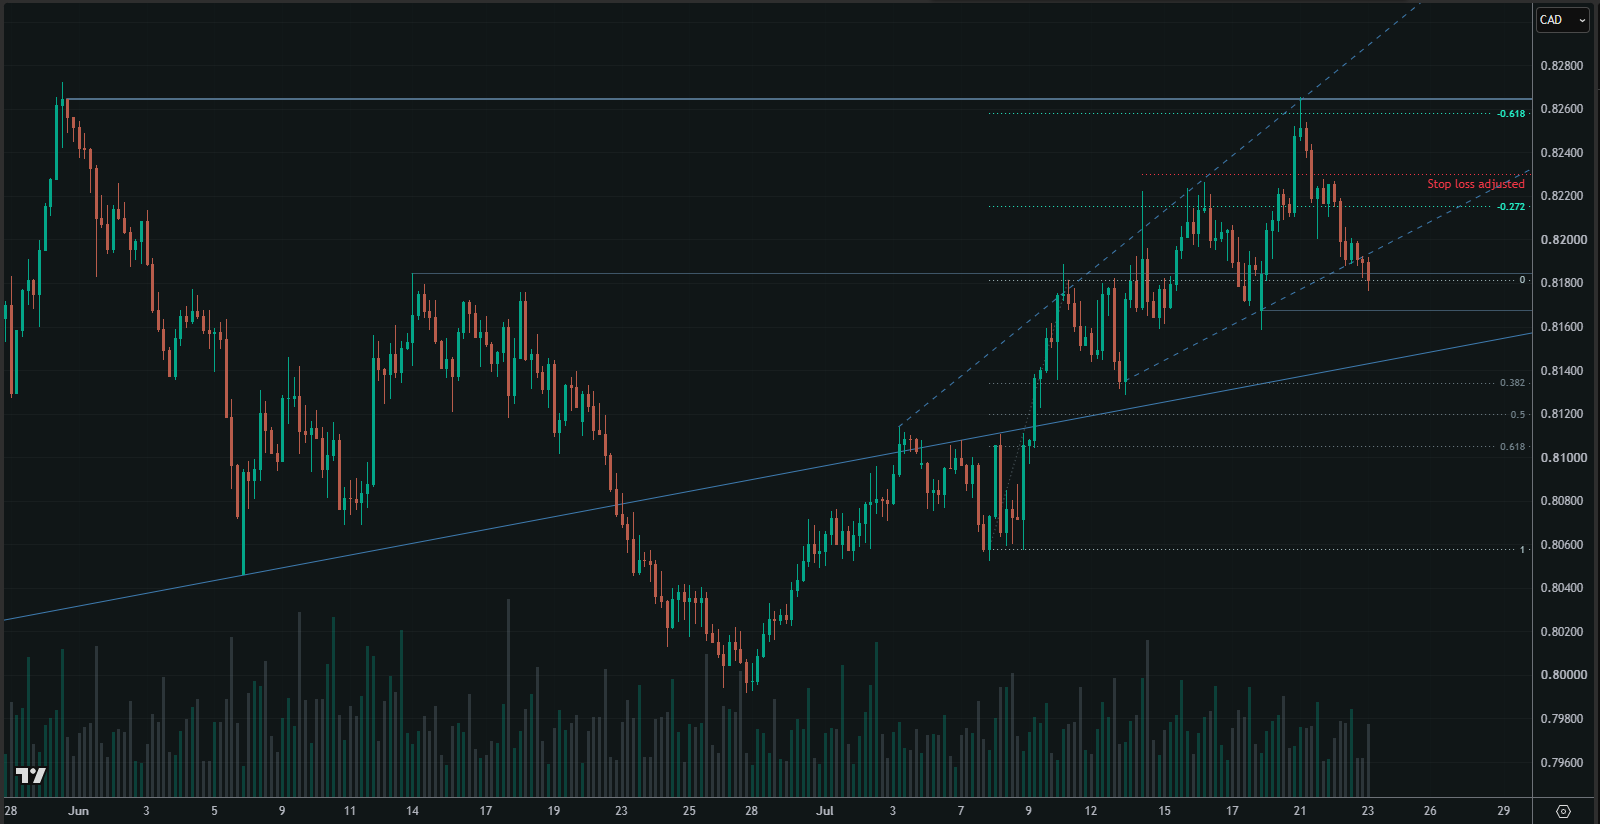
Price temporarily reacted to a very low-dependability unconfirmed trend line (low dependability due to the second anchor point being based on a gap). It now fails at the B-point of the Fibonacci range, around the area of a previous major swing high where we had a lot of transactions during the recent bullish trend.
My first action is to move the stop loss lower. If we create a higher low and get beyond the previous swing high, it’ll be showing strong bullish conviction. We would also question the strength of the zone compared to the activity behind this trend. So exiting the trade there would make sense, and I would wait for a possible re-entry, either at the zone or once a lower high is formed.
At this point, we’re back at the opening price of the week, and have clearly failed again at that zone. A significant increase in bullish activity would be needed to break higher.
Looking at the daily chart, the price may now be within an area where it may be attracted back to the zone/trend line where there’s a lot more activity. This is in favour of a continued move lower.
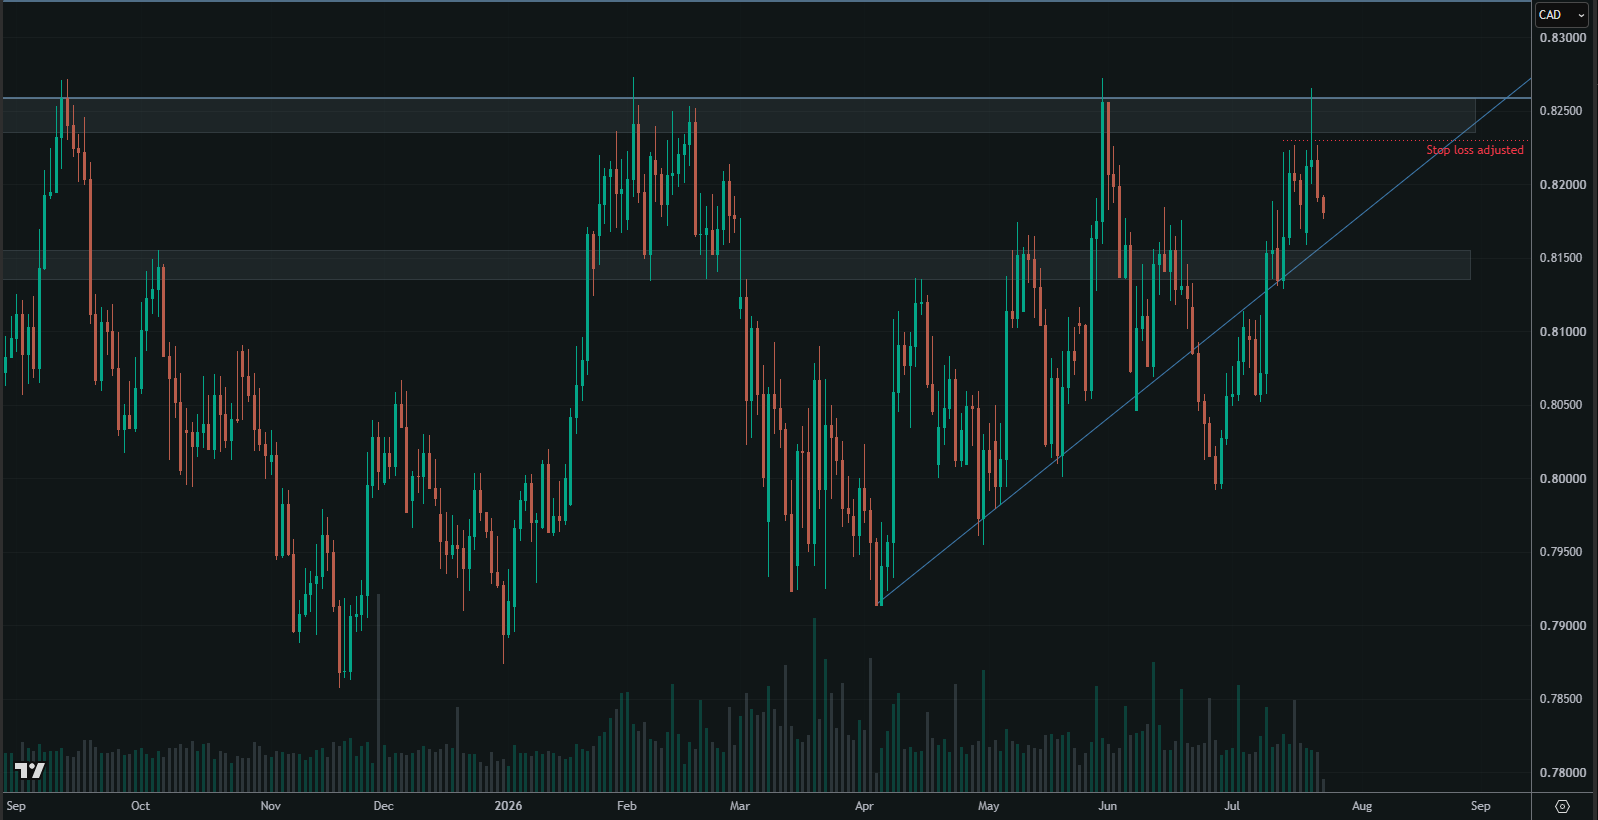
The expectancy had already improved after the previous move, and these additional points add to that. This is balanced by the wider stop position. No scale-in or scale-out is needed.
Third Decision Point
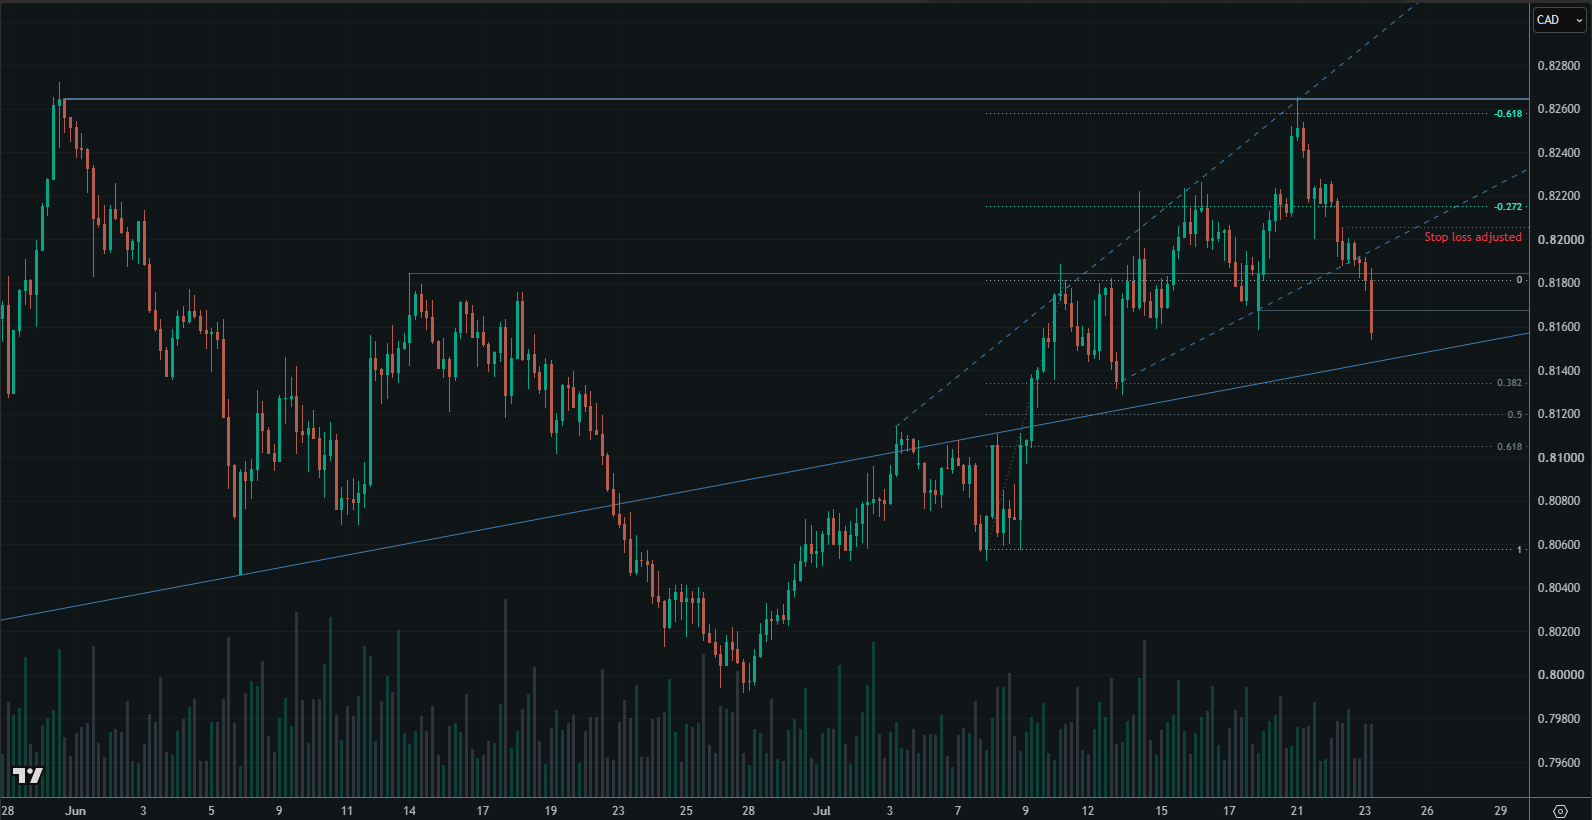
We’ve broken strong paths of resistance on the lower time horizons. However, we’re also at strong paths of resistance from the higher time horizons.
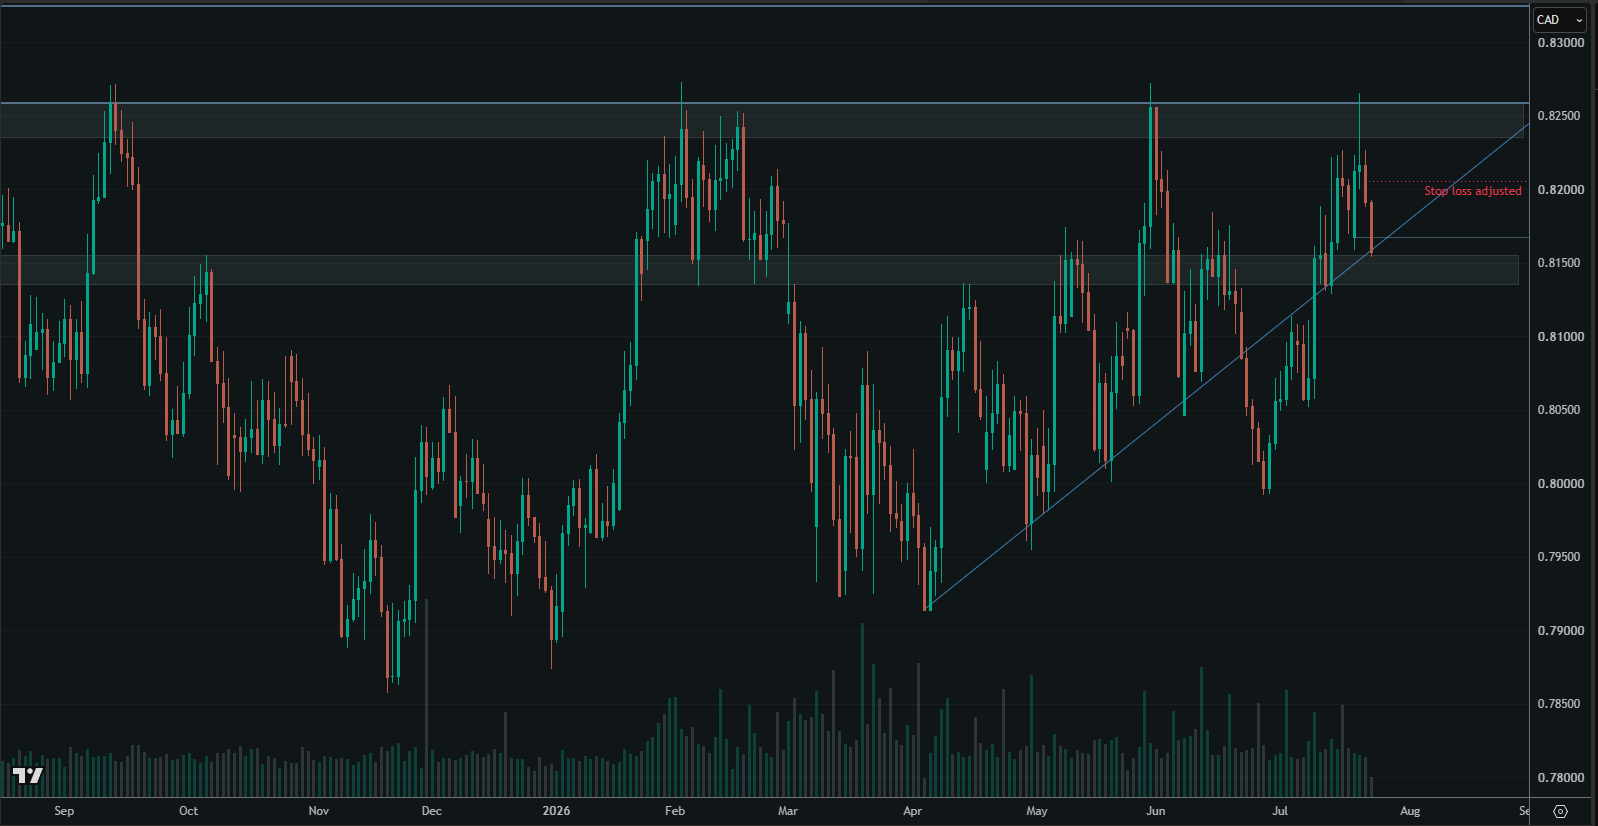
I adjust my stop loss to the point where we’d confirm a higher low. That would also confirm failure at the higher-time-horizon paths of resistance. It would also mean we’d broken back above the lower time horizon significant levels that could support a move higher.
The stop loss distance is the same as the previous adjustment. But this time we’ve had a negative change in expectancy due to the higher time frame paths of resistance.
So I have to scale out of the position, and I close 40%.
Fourth Decision Point
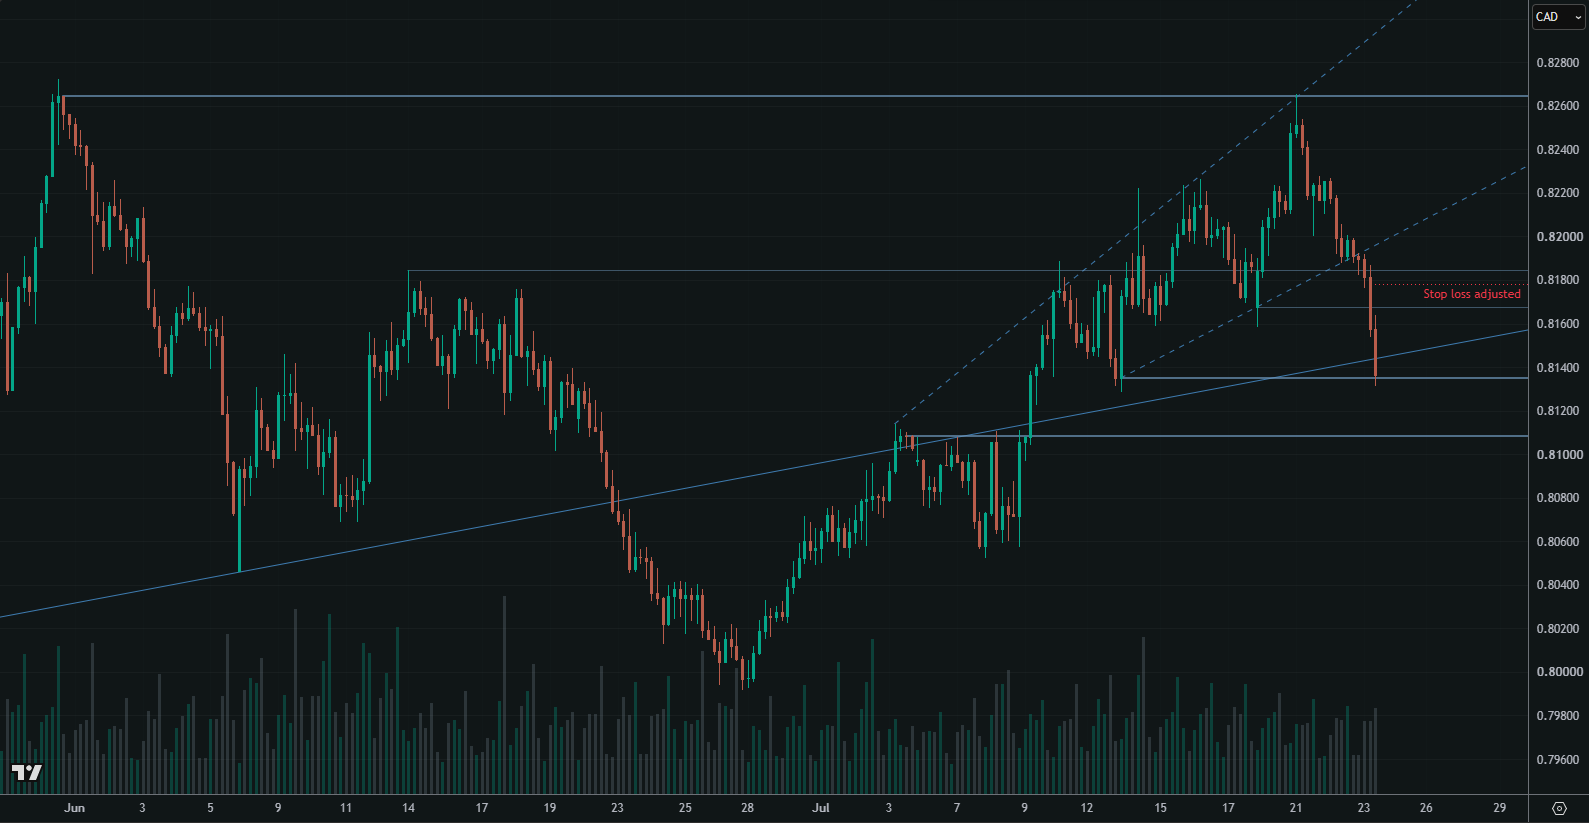
The bearish move is gaining strength and is overcoming the higher time frame paths of resistance. It’s clearing through areas where we’d expect a lot of activity, and doing so with a strong imbalance. This includes a low-dependability, long-term trend line that may no longer be relevant. This is a positive sign.
But we are now interacting with a strong swing low relative to the short-term time horizon, and we’re right at the bottom of the daily zone. The tops and bottoms of zones are more significant, so we need to keep this in mind.
I adjust the stop loss for similar reasons to the previous adjustments.
No scale-out is needed, but if the price closes back above the trend line, it will also mean it’s potentially failing at the higher time frame levels. That would significantly change expectancy, and a scale out or exit would be needed.
Trade Exit
We temporarily break below the swing, but price closes back above it and the long-term, low-dependability trend line.
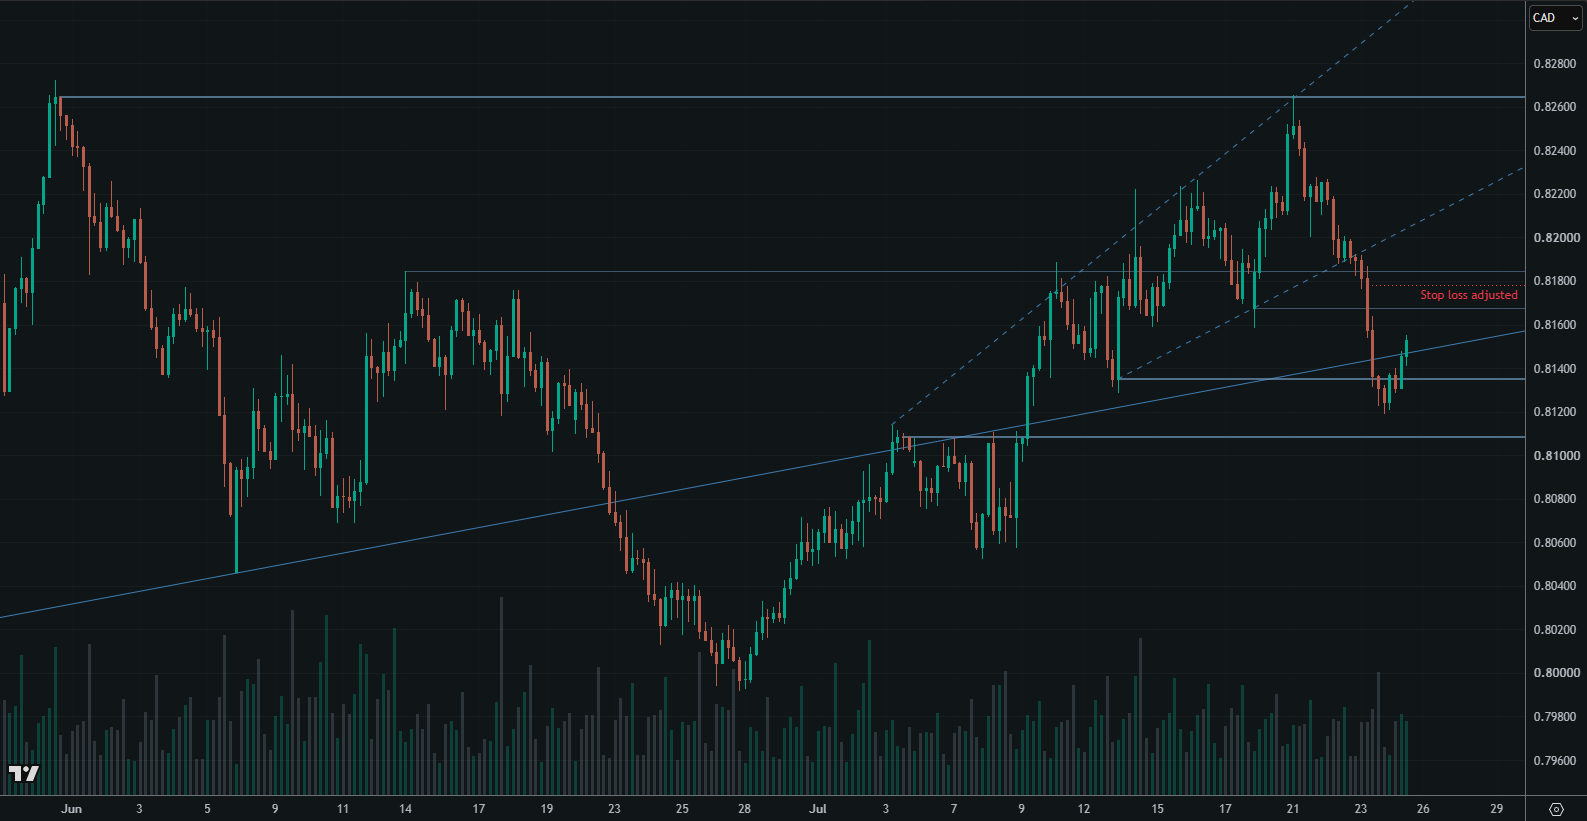
Reviewing the daily chart, we can see that we actually cleared the paths of resistance and may be testing them from below. This means they should be in favour of a further move lower.
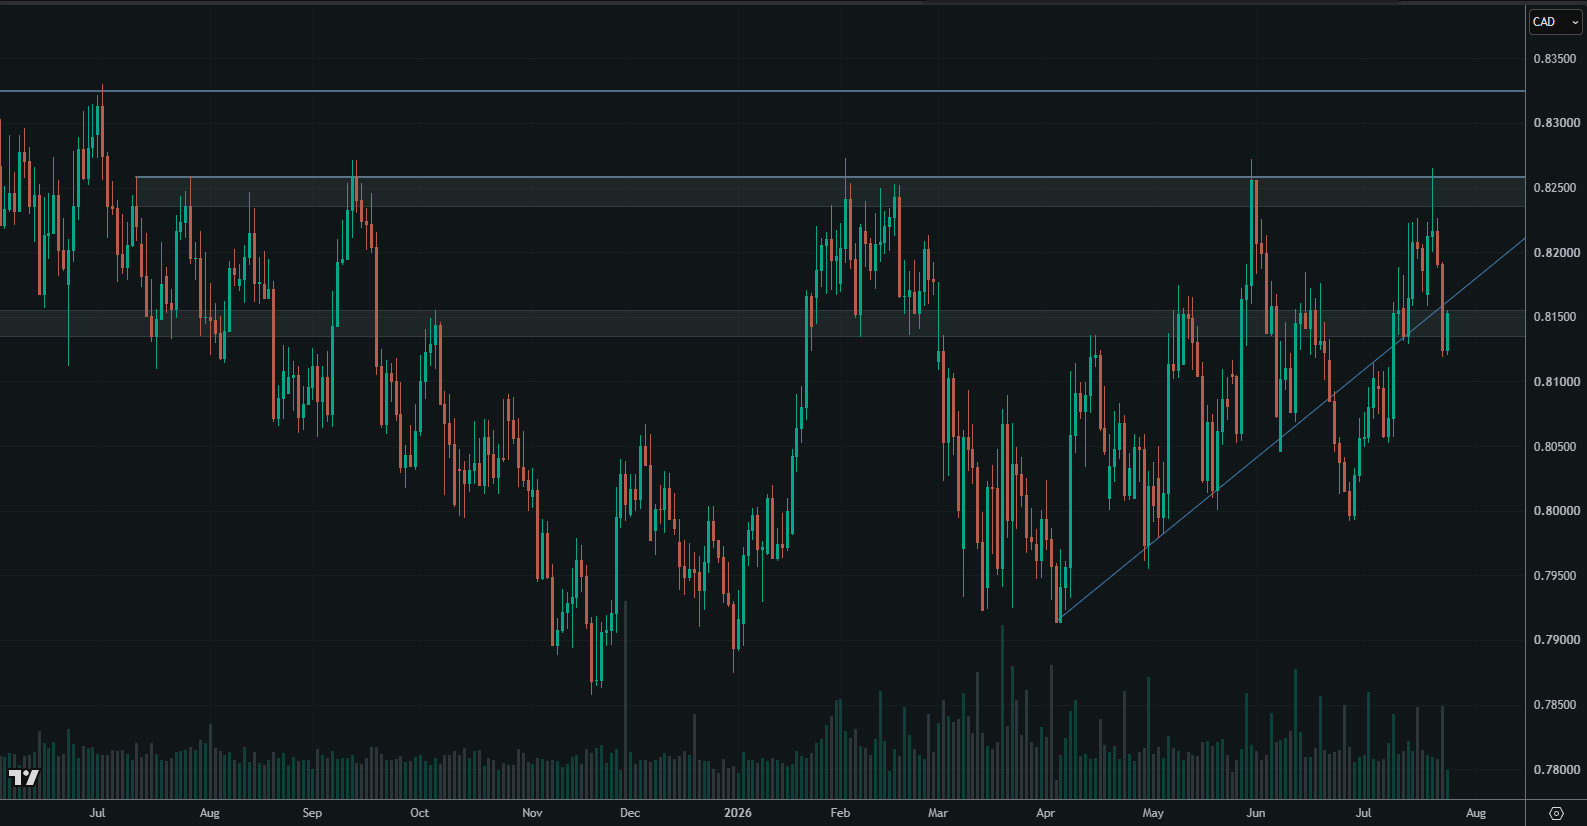
However, we’re also coming to the end of the week. Realistically, looking at the activity around this area, if this is the start of a deeper pullback, it could be several days before a continuation lower. That would involve holding over the weekend, and this situation doesn’t warrant that right now. It’s better to exit the trade and reassess it next week.
Full exit taken here. Total return (including scale-out and full exit): ~3.5%
Free Training Series
Start the free training.
Get free access to our 5-part training series. It covers the foundations of the Duomo approach, how to analyse markets logically, and the skills serious traders need to develop.