
In this post
- Trade of the week: NZD/JPY (Short)
- Quote of the Week: What success in trading comes down to
- Success rate is not the same as probability
Trade of the Week
For this week’s trade I want to briefly explain something that I’ve been teaching to our members for a long time.
Sometimes you discover a potentially huge long-term opportunity through fundamental analysis. But you’re not sure exactly when it will unfold.
It’s usually when there’s the anticipation of a big fundamental shift like a major central bank action. And it’s a case of ‘when’ not ‘if’.
It’s not always possible to time the perfect entry in those situations, so the only solution is to have positions open as often as possible.
But that can lead to many losses if it takes a long time for the opportunity to unfold.
There’s a strategy I use to deal with this, and to explain it I’ll walk you through a trade on NZD/JPY.
Full Transparency: I did not personally take this trade, as it happened while I was busy hosting our weekly members live session.
The opportunity
Over the long-term, I believe there’s a big long opportunity for the Japanese yen (which means, short for yen pairs like USD/JPY).
When the opportunity comes, the bearish move in yen pairs could happen rapidly. So I want to be in a trade before that.
Here are the steps I take:
Step 1
Take trades based on short-term opportunities with positive expectancy (intra-day or intra-week trades). Aim for a low percentage at risk with a relatively tight stop loss.
Step 2a
If the first-order outcome ends in a loss (i.e. stop loss hit), I accept the small loss and look for the next logical opportunity.
Step 2b
If the first-order outcome ends in a profit, I de-risk the trade by scaling out part of the position and leave the rest open.
Since my aim is to capture the long-term opportunity, I don’t care about the short-term profits I take. Instead, the short-term profits are just cancelling out the short-term losses so I’m neutral overall, while still having the chance to catch the bigger move.
How this applies to the current yen opportunity
My go-to pair for trading a yen opportunity would be USD/JPY. But that isn’t a viable option at the moment.
USD/JPY has been steadily rising, which means it’s difficult to catch a logical short-term bearish opportunity with positive expectancy.
Therefore, we’ve been looking at other yen cross pairs to find one that has the ideal short-term context.
NZD/JPY gave us exactly what we needed. Rather than being in a bullish trend, it was stuck in sideways structure.
This sort of market is ideal for catching multiple short-term opportunities.
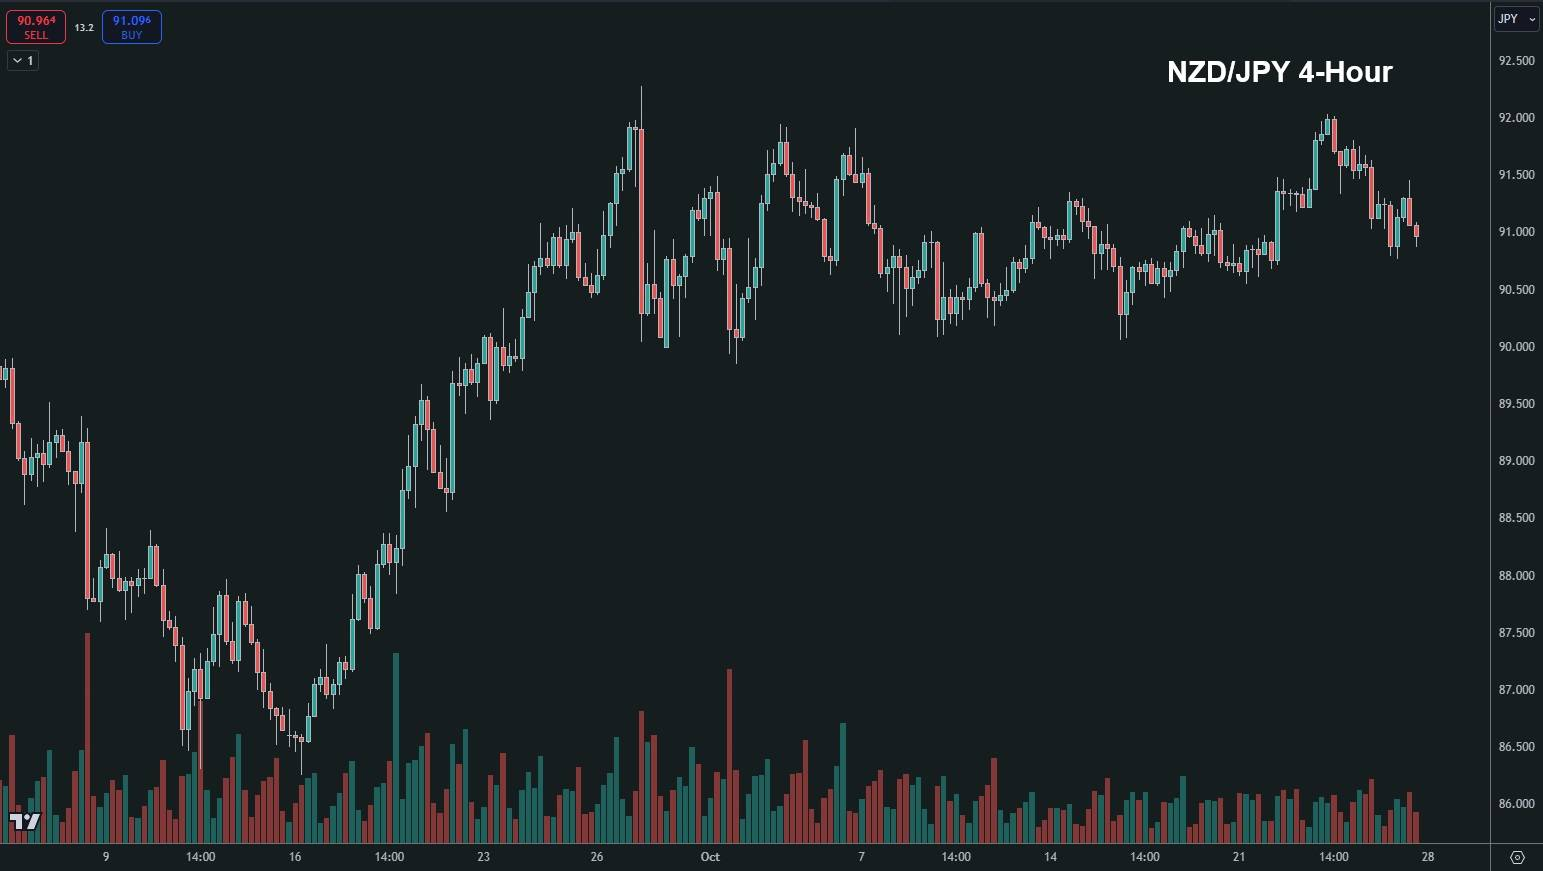
Our options were:
- Take a short trade when there’s a setup after failure at the top of the range.
- Wait for short-term bearish structure and find a setup showing failure after a bullish pull-back.
The second option is what we were able to find. If we look at the 1-hour chart below, we can see the price entered bearish structure and we were testing the previous lower high.
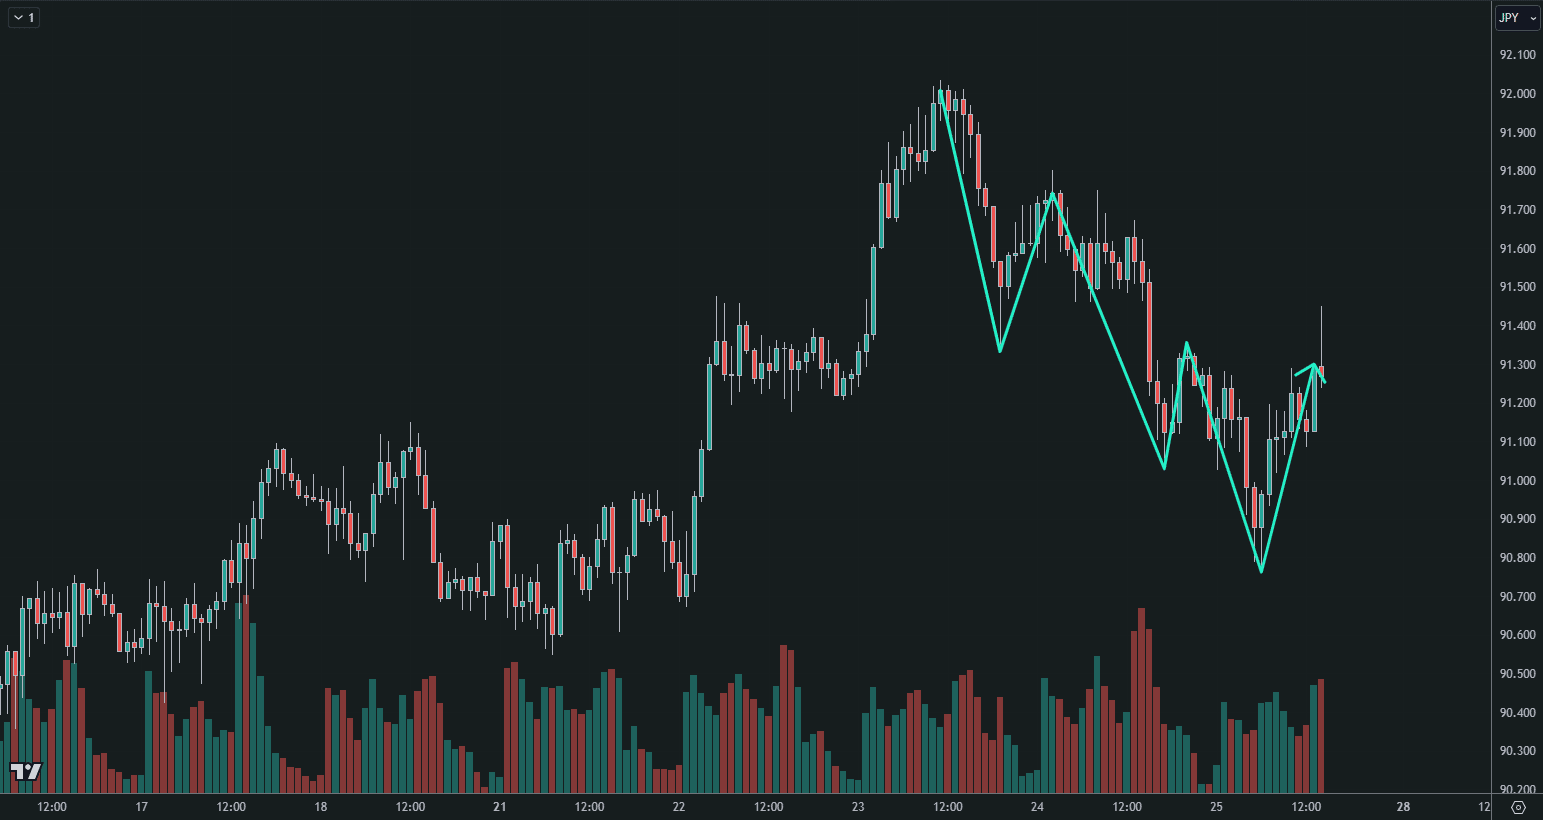
This is a great area to be looking for a short opportunity, because it’s a critical point for the context.
That means, it’s naturally asymmetric and our stop loss can be tight because a break of that high would change the context.
All we had to do was find a setup that was logical and had positive expectancy. That’s what we found on our working time frame, the 15-minute chart:
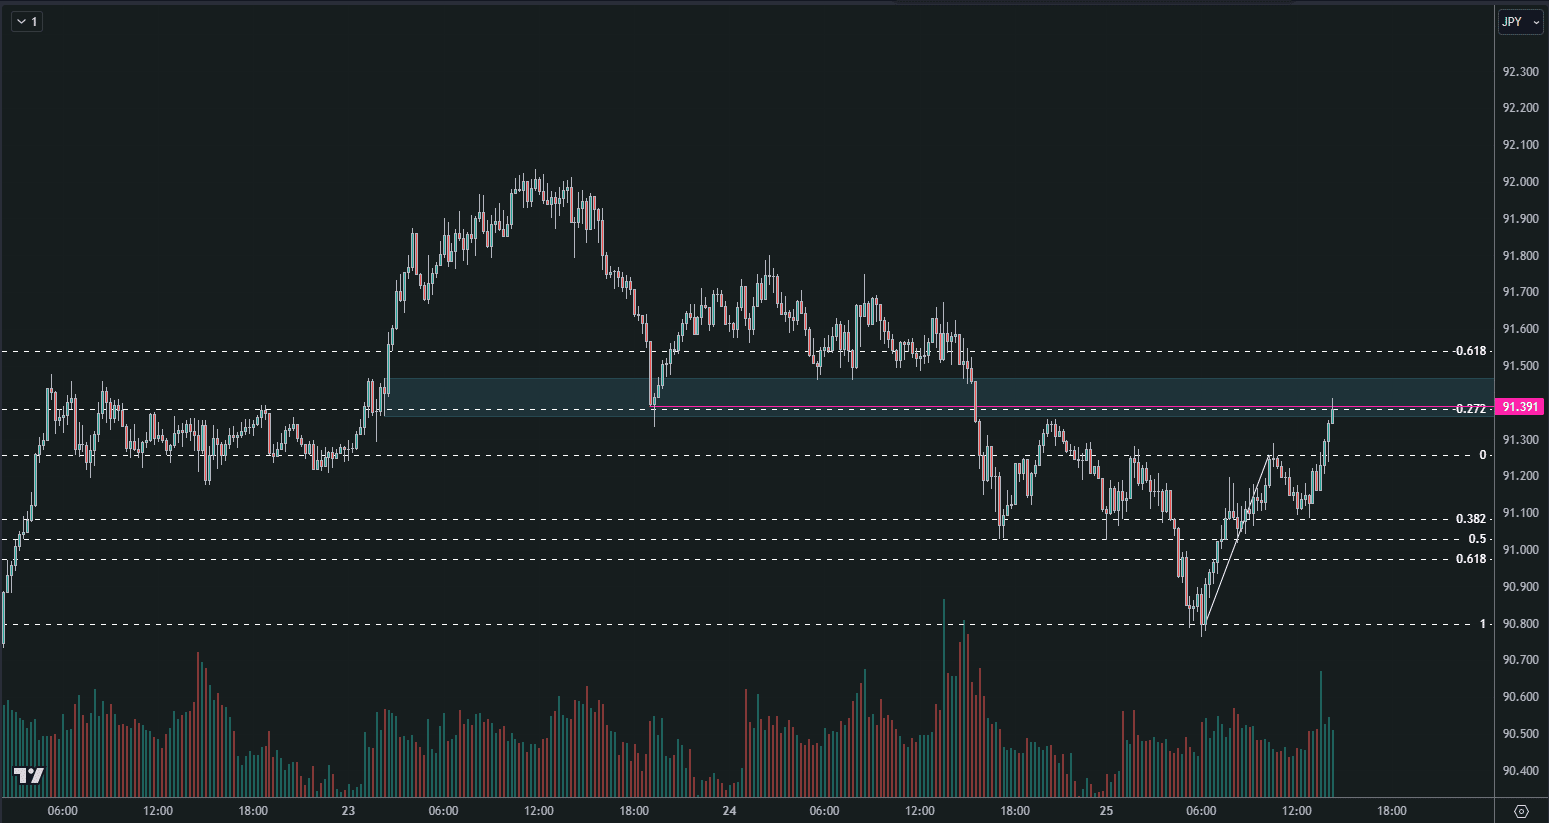
The price had failed within a zone. The zone emerged from a build up of activity before the price broke a previous persistent range. The significance was confirmed by subsequent retests.
We then had a confirmed 127.2 level almost exactly in line with a relatively major swing. We had a Type 2 failure close at that path of resistance, which fulfilled the criteria for an entry.
There was also other analysis which I’ve removed to keep the chart clean for this example. But with all things considered, it wasn’t the strongest entry point if you considered it in isolation.
However, we did estimate the probabilities and found it had positive expectancy. Combined with the bigger picture strategy, it was a great entry to take for this overall opportunity.
Here is how the market looked at the close of the week:
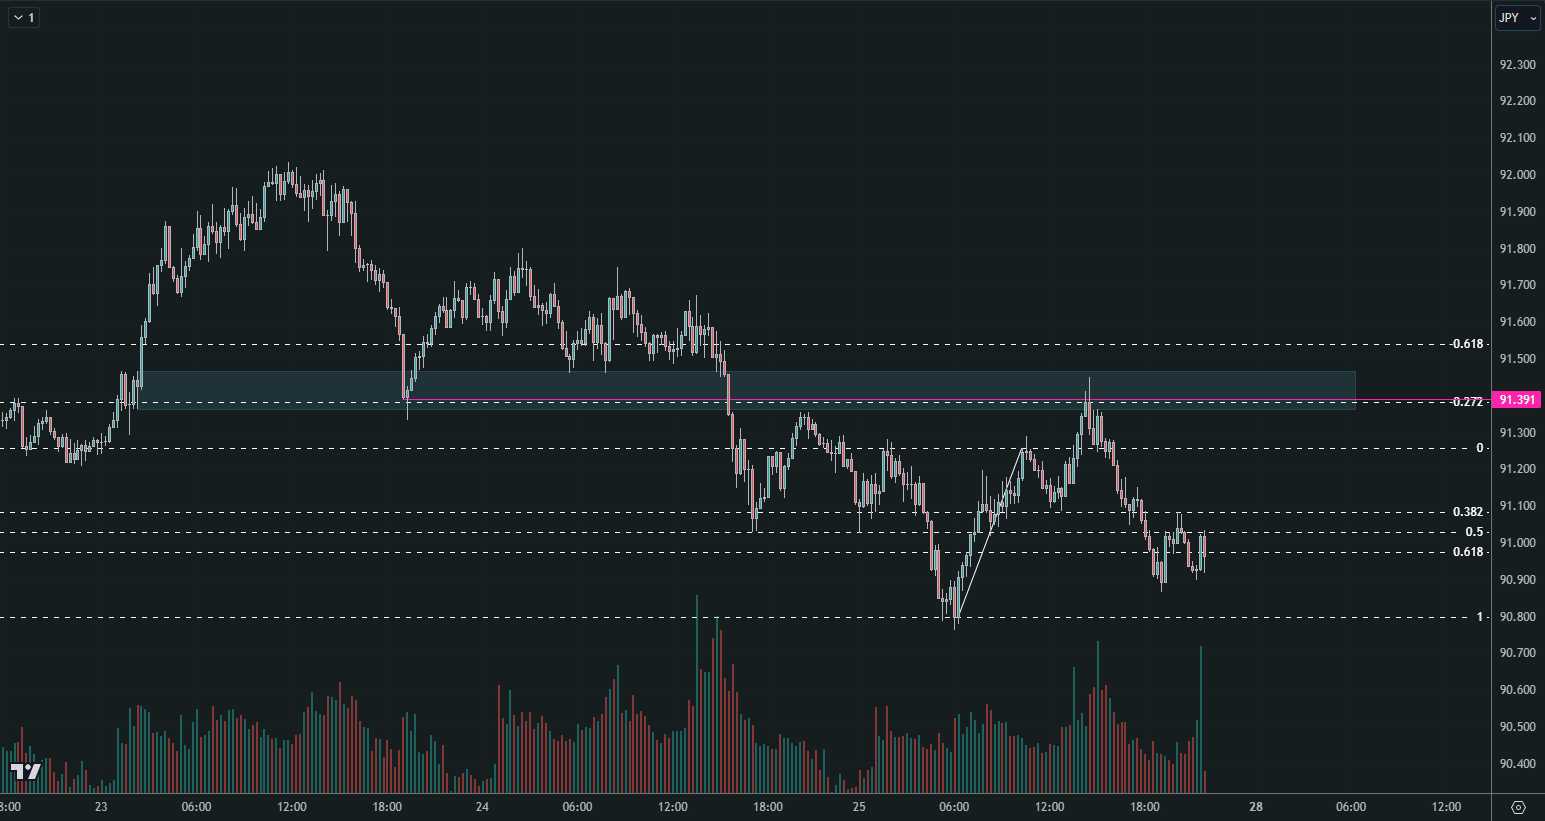
This profitable move meant we could move our stop loss to break-even, and bank a partial profit.
As a result, we have a position open for the potential longer-term opportunity and have already taken a profit. It’s a win-win.
If the market continues bullish from here and the stop loss is hit, that’s fine. We’ll look for another logical entry, and the partial profit we banked will cancel out a potential future loss.
If you’re not already a member and you want to follow my analysis and learn how to spot precise trades like this for yourself, check out the Duomo Trader Development Program.
Quote of the Week
“Over a period spanning more than seven years, from June 2006 to October 2013, I examined 1,866 investments, representing a total of 30,874 trades made by 45 of the world’s top investors - all of whom I had the privilege of managing as part of my job as a fund manager at Old Mutual Global Investors.
In the process I discovered that successful stock market investing is not about being right per se - far from it. Success in investing is down to how great ideas are executed.
I have come to understand that if successful property investing is all about ‘location, location, location’, success in equity investing is all about ‘execution, execution, execution’.”
— Lee Freeman-Shor
Identifying the longer-term direction of a market doesn’t make you a great trader. After all, even if you flipped a coin for it, you’d be right 50% of the time.
The key to successful trading comes down to how you structure and execute your trades, and why. Most traders spend too much time trying to figure out how to find better entries, and not enough time working on how to structure and execute their trades.
Success Rate Is Not the Same as Probability
If you scroll through trading-related posts on social media, you’ll spot a bit of a trend.
Whether it’s simple chart patterns, indicators, ICT, SMC, or any other nonsense, you’ll see traders saying things like: “this setup has a 75% success rate”, or “if you take this sort of entry you’ll profit 80% of the time.”
Most of the time, these percentages are just plucked out of thin air. But even if we assume they’re real, these traders are making a big mistake:
The success rate of a setup is not the same thing as probability.
Watch my video from this week to understand why.
Free Training Series
Start the free training.
Get free access to our 5-part training series. It covers the foundations of the Duomo approach, how to analyse markets logically, and the skills serious traders need to develop.